Entertainment news
Electrocardiogram features in non-cardiac diseases | JMDH – Dove Medical Press
Introduction
In this current era of remarkable progress in paraclinical diagnosis reflecting cardiac activity, the electrocardiogram still remains a dependable, affordable and widely used test. In emergency wards, the ECG is routinely the first test performed, within minutes past admission of a critical patient. Heart electrical activity may reflect either structural and functional disturbances, or systemic influences from non-cardiac origin, such as inflammation, vasopressor stimuli, hormonal influences, ionic electrical changes, direct cardiomyocytes toxic effects and hemodynamic variations induced by neurologic disturbances.
For emergency practitioners, especially, but not only, the ability to recognize ECG patterns, albeit non-specific, but highly suggestive of severe non-cardiac diseases, arouses considerable interest. The formulation of an appropriate diagnosis may emerge from suggestive ECG tracings, which, in turn, will impact patient outcomes through early downstream diagnostic and therapeutic measures.
In the current article, we aim to provide a comprehensive exploration of several major non-cardiac diseases, shedding light on their specific electrocardiogram patterns and the underlying causes that contribute to these aberrations in cardiac electrical activity. Each non-cardiac disease discussed will be accompanied by a detailed exploration of the characteristic ECG findings associated with it. By highlighting the pathophysiological mechanisms, underlying these ECG changes, we aim to elucidate how systemic conditions can intricately influence cardiac electrical activity, presenting clinicians with a diagnostic framework to recognize and interpret these patterns effectively. Through this narrative review, we underscore the fundamental role of ECG in the diagnosis and management of non-cardiac diseases, emphasizing its utility as a valuable diagnostic tool in the realm of contemporary medicine. By bridging the gap between non-cardiac pathology and cardiac electrical activity, this article aims to contribute to a deeper understanding of the complex interplay between systemic illnesses and their manifestations on the electrocardiogram.
ECG Features in Stroke
Stroke is defined as an acute neurological dysfunction, characterized by a duration of 24 hours or more, or until death, which can be attributed to either hemorrhage or ischemia. Ischemic stroke stems from a compromised cerebral blood flow, leading to diminished oxygen and nutrient delivery to the brain. Its two primary subtypes are thrombotic and embolic, classified according to the source of the clot, with the latter originating from a distant site, commonly the left atrium or the carotid arteries.1–3 Hemorrhagic stroke is characterized by the rupture of a cerebral vessel and can be subdivided into subarachnoid and intracerebral hemorrhage. In subarachnoid hemorrhage (SAH), there is blood accumulation between the arachnoid and pia mater, while in the intracerebral presentation, bleeding is contained within the brain parenchyma, forming a hematoma.4–6
The precise mechanisms by which stroke is associated with cardiac injury reflected by ECG changes is not yet fully understood. However, there is a significant rise in the prevalence of major cardiac events in the first four weeks following a stroke, notedly, the appearance of acute coronary syndrome, heart failure, atrial flutter, or fibrillation, Takotsubo syndrome and life-threatening ventricular arrhythmias. The main mechanism postulated is that stroke induces hypothalamic-pituitary-adrenal axis stimulation via the paraventricular nucleus. Hypothalamic activation then leads to autonomic dysfunction, increased sympathetic tone and subsequent arrhythmias. This sympathetic overactivity also leads to catecholamine release, promoting ischemia and myocardial injury.7,8 In a statistical analysis by Sethuraman M. et al, intracranial hypertension, secondary to supratentorial brain tumors, induced electrocardiographic changes that were found to be the result of sympathetic excitation and of the subsequently substantial amounts of secreted norepinephrine, thus providing further evidence supporting this hypothesis.9
Catecholamine levels typically display a rise for a period extending from 24 hours to 5 days. During this period, ECG may reveal QT interval prolongation. Rarely, catecholamines may exhibit long-term elevation and eventually lead to Takotsubo cardiomyopathy. In such cases, ECG can depict ST-segment depression or elevation, QT prolongation, left bundle branch block and an inverted T wave.10 Excessively high catecholamine levels can also induce the activation of beta receptors, resulting in an elevation of cytosolic cAMP levels. Subsequently, this cascade of events can lead to exacerbation of oxidative stress, osmotic swelling, and ultimately, myocardial cell necrosis. Oxidative stress can decrease nitric oxide (NO) availability, leading to vasoconstriction, endothelial dysfunction, and fostering of a pro-thrombotic state.11 According to a hypothesis formulated by Scheitz et al, stroke might induce gut dysbiosis and subsequently contribute to the development of cardiac dysfunction. However, this issue is still a matter of controversy and requires further research.12
Sympathetic and parasympathetic activities are controlled respectively by the right and left hemispheres. Therefore, right insular lesions, which can be attributed to either ischemic or hemorrhagic stroke, exacerbate parasympathetic activation by impairing the sympathetic system.11 Electrocardiographic abnormalities related to right insular lesions are frequently characterized by premature atrial contractions, T wave inversion, and irregular heart rhythms including atrial fibrillation, and atrioventricular blocks. Conversely, bilateral lesions of the insula usually entail sinus tachycardia, ST-segment depression, complete heart block, as well as the aforementioned electrocardiographic presentations associated with right insular lesions.8,13
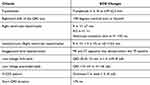
There has been described an extensive range of ECG changes associated with hemorrhagic stroke, with a specific emphasis on SAH. SAH has been related to notable ECG abnormalities that encompass ST-segment depression or elevation, the presence of large and inverted T waves, and the presence of U waves (Figure 1). Additionally, SAH may associate with other ECG disturbances such as QT interval prolongation, and a handful of abnormal cardiac rhythms, including atrioventricular blocks, bundle branch blocks, atrial flutter and atrial fibrillation, junctional rhythm, supraventricular tachycardia, and sinus bradycardia or tachycardia.7,14
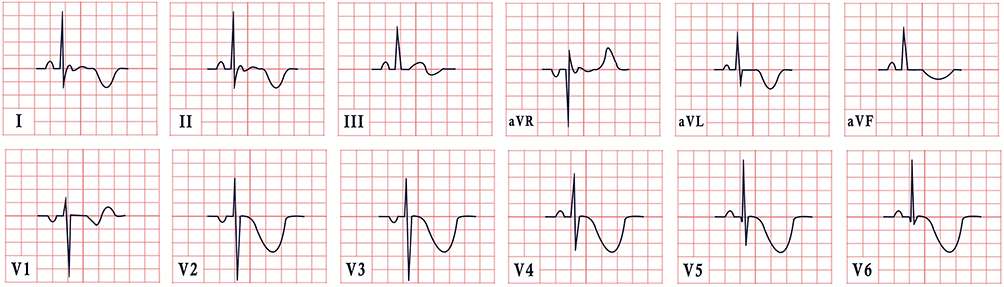 |
Figure 1 Example of an ECG feature in stroke, characterized by sinus rhythm, normal cardiac axis, giant inverted T waves. |
The majority of these newly found ECG modifications are transient, peaking a few days past the stroke onset. However, atrial fibrillation may persist or become permanent and prompt the initiation and long-term administration of oral anticoagulation in order to mitigate the associated thromboembolic risk.12
ECG Features in Migraine
Migraine is a chronic, mostly hereditary, neurological condition, characterized by pulsatile unilateral headache, which can span from moderate to severe, and is exacerbated by a variety of factors such as, for instance, light, sound, and movement. It is estimated that up to 80% of patients may experience prodromal symptoms starting 48 hours before the episode. These symptoms are more frequently neurological but can also be gastrointestinal, sensory, or expressed by general malaise.15 Migraines are a neurovascular pain syndrome, owing to the interplay of a wide range of pathophysiological mechanisms not fully understood. The most prevalent hypothesis suggests that some individuals exhibit a greater sensitivity for sensory stimuli, by which nociceptive stimuli from the meninges activate the first-order peripheral trigeminal neurons, followed by a cascade of events that stimulate different regions in the brainstem and forebrain. The trigeminal innervation within the meninges ultimately induces vasodilation and inflammation by facilitating the release of NO and neuropeptides. Furthermore, the superior salivatory nucleus also exerts parasympathetic mediation, thus contributing to vasodilation.16
Apart from the cranial parasympathetic activation, migraineurs seem to suffer from a generalized autonomic dysfunction, despite contradictory results reported by different authors: while some indicate heightened sympathetic activity, others suggest reduced sympathetic tone among migraineurs.17 Documentation of ECG changes in patients experiencing migraines include reversible electrocardiographic changes, such as prolonged QT and PR intervals, which typically resolve following the migraine attack. There have also been reports of reversible coronary artery spasm simulating an ST-segment elevation myocardial infarction on ECG. Many migraineurs also exhibit sinus tachycardia or sinus bradycardia and atrioventricular blocks.18,19
ECG Features in Kounis Syndrome
It has been widely documented for many years that certain allergens can cause cardiovascular allergic and anaphylactic reactions. After administering high doses of antipneumococcal serum to a child in 1938, Eugene Clark found reactive arthritis and carditis. Pfister and Plice reported the first case of acute MI linked to urticaria brought on by penicillin therapy in 1950.20 Kounis and Zavras did not coin the term “allergic angina syndrome” until 1991, as coronary spasm evolved into allergy acute MI.21
Kounis syndrome (KS) is defined as the concurrence of acute coronary syndromes like coronary spasm (type I variant), acute myocardial infarction (type II), and stent thrombosis (type III) in the setting of allergic or hypersensitive reactions, anaphylactic or anaphylactoid insults, and conditions associated with mast cell and platelet activation involving connected and interacting inflammatory cells.22,23 Histamine, which is generated when mast cells degranulate, is typically linked to severe allergy and anaphylactic reactions, but it can also occasionally cause atheromatous plaque erosion with rupture or severe coronary artery spasm.24,25 Type I typically arises in patients with normal coronary arteries, whereas type II is encountered in individuals with underlying atherosclerotic disease. Type II manifests in individuals with drug-eluting stents (DES), being comprised of two subtypes: stent thrombosis (subtype IIIa) and stent restenosis (subtype IIIb).26,27
In the context of anesthesia, surgery, radiology, oncology, or even dental and psychiatric medicine, KS is a complex multisystem and multi-organ arterial clinical condition that affects the coronary, mesenteric, and cerebral arteries and is accompanied by allergy-hypersensitivity-anaphylaxis involving the skin, respiratory, and vascular systems. It also has a significant impact on morbidity and mortality.28
Mast cell degranulation, which is a KS sign and reflects a silent allergic reaction, has been reported to underlie up to 13% of sudden cardiac fatalities in adults.29
Coronary artery spasm and/or atheromatous plaque erosion or rupture after an allergic reaction are both part of the KS pathophysiology. Mast cells that interact with macrophages and T-lymphocytes are the primary inflammatory cells involved in the KS development. Mast cells are prevalent in the heart tissues and are present within coronary plaques. The smooth muscle layer adjacent to a region of plaque erosion or rupture may also be invaded and injured by activated mast cells.30,31
Mast cells degranulate during hypersensitivity, releasing a number of previously synthesized and freshly formed inflammatory mediators both locally and into the systemic circulation. Among some of the mediators are biogenic amines like histamine, chemokines, neutral proteases like chymase, tryptase, and cathepsin-D, peptides, proteoglycans, cytokines, growth factors, and arachidonic acid products like leukotrienes, thromboxane, prostacyclin, and tumor necrosis factor. A sizable portion of these mediators possess cardiovascular action. Histamine causes tissue factor expression, coronary vasoconstriction, and platelet activation.32,33 All three neutral proteases can activate matrix metalloproteinases, which, in turn, can erode and rupture plaques by breaking down the collagen cap. Tryptase has both thrombotic and fibrinolytic capabilities, thereby affecting the coagulation cascade in a dual manner.34
Angiotensin I can be converted to angiotensin II, a key vasoconstrictor, via converting enzymes such as chymase and cathepsin-D. Leukotrienes are potent vasoconstrictors as well, and the acute stage of unstable angina stimulates their production.35
Mast cells have been found to infiltrate coronary arteries before an acute first event, including shoulder areas of coronary plaques prone to erosion or rupture as well as the sites of coronary arteries where plaque rupture or erosion has already occurred. In contrast to closed junctions covering the normal artery intima, the mast cell progenitors may pass through the endothelial cells that line human atheromatous plaques.36
According to Fisher et al, KS may arise as a result of anaphylaxis, with the heart as the primary site and target. Currently, it is thought that a conjunction of factors contributes to coronary hypoperfusion with subsequent myocardial injury: topping the list are systemic vasodilatation, decreased venous return, plasma leakage, volume loss due to increased vascular permeability, and the concomitant slowing of heartbeat during anaphylactic episodes.37
The acute release of inflammatory mediators can either cause coronary artery spasm without an increase in cardiac biomarkers, or conversely, coronary artery spasm that will evolve into an acute myocardial infarction with elevated troponins, creatinine kinase and creatinine kinase-MB, possibly reflecting underlying endothelial dysfunction or microvascular angina.10,38
Therefore, KS should be suspected in individuals who have systemic allergic reactions along with clinical, electrocardiographic, and laboratory signs indicating acute myocardial ischemia. The most frequent cardiac symptom of Kounis syndrome is chest pain (86.8%), followed by anaphylactic symptoms (53.0%), while particularly useful measurements include those of serum tryptase, histamine, cardiac enzymes, and cardiac troponins.39–41
Indicative of ischemia on the ECG are often ST-T alterations, with ST elevation MI being the most typical manifestation (Figure 2). These changes disappear immediately after neutralization of the allergic reaction. Regional wall motion abnormalities on the echocardiogram often mirror the impairment in blood flow distribution of the afflicted artery.42
 |
Figure 2 ECG features in Kounis syndrome, demonstrating sinus rhythm, normal cardiac axis, diffuse coved and saddleback ST elevations in leads II, III, aVF and ST segment depression in leads I and aVL. |
Treatment in Kounis syndrome may be challenging since it must concurrently address both cardiac and allergic symptoms, and medications used may exacerbate the allergy and impair heart function.25,43–46 Whereas patients with KS can expect a full recovery with the appropriate care, fatal cases have been reported.47–49
ECG Features in Pancreatitis
Acute pancreatitis (AP) is a systemic inflammatory disease of the pancreas with an increasing incidence globally. Clinically, it is characterized by abdominal pain accompanied by increased serum pancreatic enzymes (amylase and lipase). Morbidity and mortality are significant in patients with AP due to systemic complications and multiple-organ failure. Cardiac involvement also has a prominent place alongside systemic complications, the cardiac dysfunction in patients with AP being confirmed in many studies.50–52
In patients with AP, transient electrocardiographic changes are well known in the literature. The first ECG changes in AP were reported in 1934 by Drummond. Tachycardia and atrial fibrillation have been observed and suspected to be secondary to shock.53
Over the years, other authors have also identified other ECG abnormalities in patients with AP. The most common changes occur in the form of T-wave inversion, U-wave appearance, ST-segment depression and, rarely, ST-segment elevation in continuous leads to suggest acute coronary syndrome. Other changes would include sinus bradycardia, repolarization changes, nonspecific T-wave changes, accelerated atrial or nodal rhythms. These changes are present in the early phase of acute pancreatitis.50,51,53
In addition, QT interval changes, especially early repolarization, have been described as the most common ECG finding of patients with AP.50
It has been shown that regardless of the severity of acute pancreatitis, it can be associated with different forms of myocardial injury. To date, there have been a total of 34 cases in which acute pancreatitis has been presented with ECG changes consistent with acute myocardial infarction without true coronary artery thrombosis. The most common pattern of myocardial infarction was ST-segment elevation in the inferior wall.54
One explanation for the presence of these ECG changes of ST elevation, especially in inferior leads, would be related to the involvement of the vagal autonomic innervation.55
Many hypotheses have been proposed regarding the injury mechanism, including decreased coronary perfusion, direct myocyte injury by pancreatic proteolytic enzymes, indirect injury via parasympathetic activity, electrolyte disturbances, coronary vasospasm, prothrombotic disorders, hemodynamic instability, and cardiac injury induced by systemic inflammatory response.50,54
Pancreatitis is often accompanied by metabolic abnormalities such as hypocalcaemia, hyponatraemia, hypokalaemia, hypomagnesaemia, and insulin-induced hypoglycaemia. Several electrolyte disturbances can affect myocardial repolarization, leading to changes in QT interval, ST-segment elevation, U-wave appearance, and low T-wave amplitude.56
To describe ECG disorders, in patients with AP, Rubio-Tapia et al conducted a study which aimed to assess the importance of electrolytes and pancreatic enzymes in AP. Fifty-one patients with AP without pre-existing heart disease were included. Standard 12-lead electrocardiogram was performed, and serum electrolyte profile was collected. Twenty-eight patients (55%) had an abnormal ECG. The most common disorders were nonspecific repolarization changes (20%), sinus tachycardia (12%) and left anterior hemiblock (10%).57
The nonspecific repolarization changes described by Rubio-Tapia et al were later shown to be early repolarization changes, initially described as benign, but later revealed to be a prognostic parameter for ventricular tachyarrhythmias. The exact mechanism responsible for the appearance of early lateral repolarization changes is not well understood, and some authors attribute them to increased sensitivity of ventricular myocytes to the action of depressant cardiac factors, such as kinin and myocardial depressant factor.50
Pancreatic proteolytic enzymes, such as trypsin 1, can result in direct injury to the pericardium or myocyte membrane, leading to changes in cell permeability with possible necrosis and subsequent electrical changes. Kellner and Robertson demonstrated the presence of ECG changes after intravenous injection of proteolytic enzymes. Several authors have speculated that such injury may lead to transient local hyperkalemia sufficient to block depolarization, which cannot be corrected until normalization of electrolyte levels.56
The presence of a cardio-biliary reflex is another hypothesis attempting to explain cardiac injury by direct action on the myocardium or by altering coronary blood flow. Although the innervations of the heart and gallbladder come from different levels of the spine, Morrison and Swulim raised the possibility of a vagal-mediated reflex, which circulates through the intermediate neurons connecting these branches. This reflex has been cited as the putative cause of T wave changes in acute cholecystitis and is also suspected of involvement in pancreatitis, gastrointestinal hemorrhage, and intracranial bleeding.56
Although differentiation between AP and acute coronary syndrome is rarely a source of confusion, ancillary studies such as serial ECG can be extremely helpful when signs and symptoms overlap.55
AP may mimic acute myocardial ischaemia, infarction or a combination of both may simultaneously occur. Echocardiography and coronary computed tomography angiography (CCTA) are fundamental, as the diagnosis may be confirmed by abnormal motion of the left ventricular wall observed on echocardiography, along with CCTA revealing critical stenosis in coronary arteries.58 Selective coronary angiography may be useful for differential diagnosis and can prompt immediate revascularization. Administration of thrombolytic therapy in such patients is not safe and may have fatal consequences.53
Therefore, doctors should include intra-abdominal diseases in the differential diagnosis when transient ST segment elevation in inferior leads is recorded in patients with a low probability of having coronary artery disease as judged by clinical and laboratory assessment. Treatment of the underlying condition leads to resolution of the ECG changes.55
It is imperative that doctors be aware that AP can mimic an acute myocardial infarction. Although we have begun to better understand the pathological mechanisms of this phenomenon, further research focused on specific molecular target areas is needed.54
ECG Features in Toxicology
Myocardial damage occurs after acute exposure to xenobiotics, posing a significant predictor of mortality in many of these situations.59,60 In patients poisoned with undifferentiated drugs and nonpharmaceutical substances, the need for ICU hospitalization is correlated with higher levels of biomarkers, within 24 hours of exposure, such as high-sensitivity C-reactive protein, red cell distribution width, neutrophil–lymphocyte ratio, and monocyte–lymphocyte ratio.61
Beta-Blockers
Beta-blockers or beta-adrenergic receptor blockers are a class of medications indicated for the treatment of a variety of cardiovascular disorders, such as hypertension, chronic heart failure, ischemic heart disease and cardiac arrhythmias, as well as for prevention of migraine and treatment of portal hypertension, essential tremor, and thyroid storm.62 Three subtypes of beta-adrenergic receptors may be found in the human organism; beta-1 (β1) receptors located in the heart and kidney, beta-2 (β2), which are the most abundant, found in smooth and skeletal muscle, the ciliary body of the eye, the liver and pancreatic beta cells and finally, beta-3 (β3) receptors which are exclusively located in adipose tissue.63 Beta-blockers can be divided according to their beta-receptor blocking activity into selective and non-selective. β1 blockers exert a dose-dependent cardioselective effect, by competitively inhibiting the action of epinephrine and norepinephrine and producing a negative chronotropic, inotropic and dromotropic effect. Moreover, by acting in the juxtaglomerular cells in the kidneys, they decrease renin release and blood pressure.64 Non-selective beta-blockers inhibit the effects of both β1 and β2 receptors, favoring bronchoconstriction, masked hypoglycemia, unopposed vasoconstriction, and subsequent hypertension.63
In a study conducted by Love J. et al, a cohort of 167 patients underwent electrocardiographic assessment as soon as they presented to the emergency room with beta-blocker intoxication. The most frequent ECG manifestation was first degree atrioventricular conduction block, with a P-R interval duration over 200 milliseconds. It was followed by QRS interval prolongation, also known as intraventricular conduction delay and QT prolongation which may then lead to “torsades de pointes”. These changes were more prominent in patients who had ingested acebutolol and sotalol. Although bradycardia is thought to be a cardinal symptom of beta-blockers, it was only demonstrated in 3 out of 13 patients’ initial ECG.65,66 However, QTc prolongation is a well-known ECG parameter which correlates with mortality in a wide range of acute poisoning episodes.67
Calcium-Channel Blockers
Calcium-channel blockers (CCBs), also known as Ca2+ antagonists, are a drug category frequently prescribed for the treatment of ischemic heart disease, hypertrophic cardiomyopathy, hypertension, supraventricular arrhythmias, pulmonary hypertension, subarachnoid hemorrhage, Raynaud’s disease, and prophylaxis of migraine. They are divided into two chemical classes: the dihydropyridines, such as amlodipine and nifedipine and non-dihydropyridines, including verapamil and diltiazem.68,69 Both classes of CCBs block the entry of calcium ions into the voltage-gated L-type channels, therefore causing peripheral vasodilation and hypotension. Verapamil and diltiazem also act on the L-type channels in the cardiac muscle, thereby inducing negative inotropic and chronotropic actions by reducing the automaticity of the sinus node and propagation of nervous impulses through the atrioventricular node.70,71
When non-dihydropyridine CCBs are ingested in toxic amounts, several electrocardiographic changes are demonstrated: sinus bradycardia72 PR interval prolongation and several degrees of atrioventricular (AV) block, QT interval prolongation, and widened QRS complexes due to bundle branch blocks. Junctional escape rhythm with absent or inverted P waves may be documented as well. On the contrary, in dihydropyridine CCBs intoxication, no ECG changes are observed other than reflex sinus tachycardia.73
Digoxin
Digoxin, commonly referred to as digitalis, is a cardiac glycoside derived from the plants Digitalis lanata and Digitalis purpurea. It is indicated for the treatment of heart failure with reduced ejection fraction, atrial flutter, and fibrillation. Digoxin acts by inhibiting the sodium-potassium ATP-ase, which in turn increases the inflow of calcium ions, thereby provoking a positive inotropic response. Digoxin also suppresses the atrioventricular node through stimulation of the parasympathetic system, leading to bradycardia.74
Digoxin overdose typically presents with a distinctive downsloping ST-segment depression originating from the J-point, also known as “Salvador Dali appearance”, “reverse tick” or “scooping” ST-segment (Figure 3). Other electrocardiographic elements include PR prolongation, a shortened QT interval and inversion or flattening of the T wave. Arrhythmias such as sinus and ventricular tachycardia, atrial fibrillation and various degrees of AV block are common features, as well.74–76
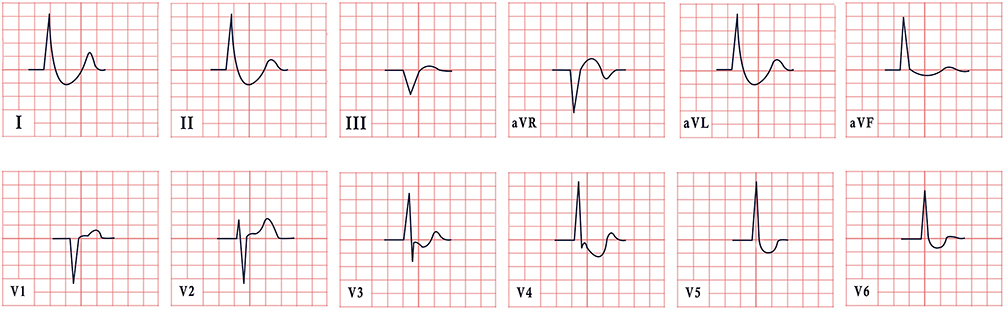 |
Figure 3 ECG features in digoxin intoxication, revealing absent P waves, normal cardiac axis, and a distinctive downsloping ST-segment depression in leads I, II, aVL, V4-V6. |
Paracetamol
Paracetamol or acetaminophen is an over-the-counter analgesic and antipyretic medication. Although its exact mechanisms of action are not fully known, paracetamol has been shown to inhibit COX-2, resulting in decreased production of prostaglandins. Paracetamol activates the descending serotonergic pathways to increase serotonin levels and to stimulate the cannabinoid receptors.77
ECG abnormalities are more often encountered in patients with hepatic encephalopathy due to paracetamol poisoning, but they can also manifest in patients devoid of toxicity. The most common findings are cardiac ischemia and myocardial infarction, manifested by new ST-segment depression, ST-segment elevation, and T wave inversion.78,79 Malignant arrhythmias such as ventricular tachycardia, ventricular fibrillation and accelerated idioventricular rhythm are also frequently observed.80
Carbon Monoxide
Carbon monoxide (CO) is a tasteless, odorless, and colorless gas that is usually the by-product of the incomplete combustion of gas-powered appliances, fires, or smoking exposure. When inhaled, CO binds to hemoglobin and myoglobin with a stronger affinity than oxygen, therefore resulting in the formation of carboxyhemoglobin and carboxymyoglobin, leading to the decrease of the blood oxygen carrying capacity and depletion of myocardial stores.81
CO poisoning has been frequently associated with acute coronary syndrome. In many instances, ECG during CO intoxication exhibits new ST-segment depression, ST-segment elevation, and T wave inversion.79 This sort of intoxication has also been characterized by the emergence of a prolonged PR interval, broadening of the QRS complex and several dysrhythmias, such as the Brugada pattern, and atrial and ventricular fibrillation.82–84
Ethanol
Ethanol or ethyl alcohol is a clear, transparent, and volatile liquid. It is the main active substance of alcoholic beverages and is often consumed as a recreational substance. Ethanol stimulates the inhibitory effects of Gamma Amino Butyric acid on the central nervous system (CNS), by strongly binding to these receptors and therefore, resulting in sedative effects and impaired coordination.85 While excessive alcohol consumption over a short period can lead to transient electrical atrial remodeling, also known as “Holiday heart syndrome”, sustained chronic alcohol abuse has been demonstrated to induce ventricular dilatation, a negative inotropic effect, and impaired systolic and diastolic functions, also known as alcoholic cardiomyopathy.86,87
ECG changes resulting from alcohol intoxication can display various distinctive patterns. Notably, prolongation of the PR interval, the QRS complex and the QT interval are common, significantly increasing the risk for fatal arrhythmias. Other ECG changes include ST-segment depression and T wave inversion or flattening. In many cases, sinus tachycardia, premature atrial contractions and atrioventricular of all degrees may be observed. Additionally, excessive alcohol consumption is associated with the development of atrial fibrillation and ventricular arrhythmias.88–90
Ethylene Glycol and Methanol
Ethylene glycol is an odorless, transparent liquid utilized in the hydraulic brake system and as antifreeze for car engines. Upon liver metabolism, it is broken down into glycolic acid, glyoxylic acid, oxalic acid and glycolaldehyde. These compounds are severely toxic, affecting initially the CNS with encephalopathy and coma, then causing heart and pulmonary failure and finally, renal failure and late neurological complications.67,91,92
Methanol, also known as wood alcohol and Colombian spirit, is a clear liquid found in solvents, antifreeze, coolants, and carburetor fluid. It also has various applications in industrial and commercial purposes as a chemical intermediate of several products.93,94
Frequent ECG abnormalities associated with toxic alcohols (methanol and ethylene glycol) poisoning are QT interval prolongation, often leading to “torsades de pointes”, PR interval prolongation and atrio-ventricular block. Additionally, the occurrence of sinus tachycardia is a frequently observed phenomenon. In a case presented by Dibajnia et al, the ECG findings at the time of initial evaluation were indicative of myocardial infarction as patients exhibited newly found ST-segment elevation and T wave inversion.95–98
Organophosphates
Organophosphates are organic compounds of phosphoric acid that have extensive applications as insecticides and acaricides in fields, such as agriculture, horticulture, and veterinary medicine, whereas their domestic use is very limited. These insecticides irreversibly inhibit acetylcholinesterase leading to a buildup of acetylcholine and excess stimulation of the CNS, muscarinic and nicotinic receptors.61,99
According to Ludomirsky et al, complications pertaining to the heart evolve in three stages. During the first stage, sinus tachycardia is noted due to heightened sympathetic activity. As the second stage begins, prolonged parasympathetic activity mounts up, expressed by ST-segment and T wave abnormalities and frequent bursts of atrioventricular block. In the third and final stage, prolongation of the QT interval can emerge, paving the way to “torsades de pointes” and ventricular fibrillation.100
Mushrooms
Mushrooms are a quite common source of intoxication, with over 2000 types listed globally. However, it is noteworthy that only 50 types have proven to be toxic. Among these toxic species, Amanita phalloides, commonly known as the Death Cap mushroom, stands out as the most toxic and is associated with the highest rates of mortality. The Amanita mushroom contains three different toxins. Among these, amatoxin plays the most significant role in clinical practice, as it resists thermoregulation and cannot be destroyed by cooking. Amatoxin primarily exerts its effects on the liver and kidneys, and within the span of a few days following the ingestion, acute liver and renal failure ensue.101
ECG changes may vary according to the species of mushroom ingested. However, the most widely ECG documented disturbances are sinus tachycardia, ST-segment depression, and nonspecific T wave changes, as well as electrocardiographic changes suggestive of myocardial injury.102 Moreover, QT interval prolongation and life-threatening arrhythmias may follow.103,104
ECG Features in Hypothermia
Hypothermia is a condition that occurs when the body loses heat faster than it can generate it, resulting in a dangerously low body temperature. It may result from accidents, metabolic derangements, or therapeutic interventions. Body temperature averages 36.6 degrees Celsius (97.88 degrees Fahrenheit) in normal functioning human organisms, while hypothermia occurs when body temperature falls below 35 degrees Celsius (95 degrees Fahrenheit). Hypothermia severity based on the core temperature is regarded as mild (from 35 to 32 degrees Celsius), moderate (from 31 to 28 degrees Celsius) and severe (from 27 to 24 degrees Celsius) and in some cases profound (lower than 24 degrees Celsius). In hypothermia, vital organs become dysfunctional, and if not managed on time, general organ failure ensues.105
Aside from clinical signs and symptoms, ECG changes play a crucial role in hypothermia diagnosis. ECG changes in hypothermia are diverse and the majority is based on clinical case reports. One primary mechanism is related to the ion channel changes specific for patients with hypothermia. As body temperature starts dropping, the transport of sodium, potassium, and calcium ions across the cell membranes and heart electrical activity becomes impaired, resulting in various ECG changes. Bradycardia stands as one of the most frequent arrhythmias following hypothermia and may be explained by the slowing depolarization of cardiac pacemaker cells as body temperature decreases. The intensity of bradycardia is associated with the nature and severity of hypothermia. During therapeutic hypothermia (TH) 49% of patients may present with a heart rate below 50 beats per minute. Lengthening of PR interval can also occur in hypothermia and may be explained by both delayed repolarization and depolarization of heart electrical waves. Furthermore, reduced ion channel function may particularly affect the activity of potassium channels responsible for repolarization.10,105
Appearance of J-waves (Osborn waves, camel-hump sign) is another ECG sign in hypothermia (Figure 4). J-waves emergence during ventricular repolarization is mainly caused by the redistribution of electrical currents within the heart under conditions of low temperature due to changes in ion channel conductance. A J-wave during hypothermia has been reported in 80% of patients.106 Despite the absence of consensus regarding the prognostic role of J waves in hypotension, they are believed to play a crucial role in the assessment of outcome among patients with ischemic heart disease. For instance, Feldman A. et al reported a poor prognostic role of J waves during therapeutic hypotension among sudden cardiac death survivors.107 Osborn wave, characterized by narrowing of the QRS complex at the junction of the R-wave and ST interval and may mimic the so-called R’ wave. Although the underlying mechanism is unknown, the most plausible explanation involves gradient differences between epicardium and endocardium during hypothermia, which could cause early repolarization. In most cases, this is observed in lower and lateral wall leads, particularly in V3-V6, but sometimes in V1-V2, as well.108
 |
Figure 4 ECG features in Osborn syndrome, presenting sinus rhythm, normal cardiac axis, and the characteristic diffuse J point with R’ aspect. |
Prolongation of QTc intervals is often apparent in hypothermia. This ECG change may be caused by hypokalemia and hypomagnesemia, common findings in hypothermia. Shortening of QRS intervals has also been reported in hypothermia. The QRS interval is associated with ventricular depolarization and a small, albeit significant, shortening of QRS can be observed in hypothermia, which may be due to the prolongation of repolarization phase rather than speeding of depolarization phase. Other disturbances such as sino-atrial exit block, PR prolongation, QRS widening, ST depression, atrial and ventricular fibrillation, though nonspecific for hypothermia may also be observed in patients affected by this condition.109,110
The prevalence of ECG findings in hypothermia varies among different authors. For example, de Souza et al found bradycardia in 52.5% patients, T wave changes in 47.4%, QT prolongation in 72.8%, J wave presence in 88%, idioventricular rhythm in 10%, AV block in 5% and junctional rhythm and atrial fibrillation in 3.4%.108 Rolfast et al found that 30% of patients had Osborn waves that disappeared in 92% of instances after discontinuing TH. New ST segment elevation emerged during TH either in patients with or without documented myocardial infarction and also vanished after its discontinuation.111
ECG Features in Esophageal Disorders
Gastroesophageal reflux disease (GERD) is a chronic condition characterized by the recurrent influx of gastric acid into the esophagus, commonly presenting with pyrosis and regurgitation. GERD can be mostly attributed to either reduced lower esophageal sphincter (LES) pressure or transient relaxations of LES.112 Autonomic system abnormalities have been suggested as potential factors contributing to the defective LES function, while the exact mechanisms are still a subject of debate. Many authors have reported the concurrent inhibition of both the sympathetic (SNS) and parasympathetic (PNS) systems, whereas others have noted an enhanced PNS and diminished SNS activity. Nevertheless, this imbalance between SNS and PNS leads to transient relaxations of the lower esophageal sphincter unrelated to swallowing, persisting for over 10 seconds, and associated with gastroparesis.113,114
In a study conducted by Kaya et al, researchers investigated the cardiac manifestations in patients with GERD. The study revealed two notable findings, namely, QT interval prolongation and an increased interval from the peak of the T wave until its end (Tpe). Whilst the QT interval reflects the duration of ventricular depolarization and repolarization, the Tpe represents the duration of transmural dispersion of ventricular repolarization. Both findings embody an arrhythmogenic potential that may end up in sudden cardiac death, as both potentially lead to ventricular tachycardia, “torsades de pointes” and ventricular fibrillation.114,115
ECG Features in Pulmonary Embolism
There is a wide range of ECG derangements in patients with pulmonary embolism (PE) consistent with the increased physiological demands for cardiac output and decreased left ventricular stroke volume.116 Nevertheless, approximately 10–25% of patients with PE have normal ECG findings.117
In a study that involved 6049 patients, 354 of whom were diagnosed with PE, several ECG changes were associated with a positive likelihood ratio of PE such as S1Q3T3 pattern, non-sinus rhythm, inverted T waves in leads V1-V4 and tachycardia (pulse rate >100 beats/minute).118
In a meta-analysis of 45 studies of 8209 patients, the most common ECG signs in patients with PE were tachycardia (38%), T-wave inversion in lead V1 (38%), and ST elevation in lead aVR (36%). Six electrocardiographic criteria were associated with increased risk of circulatory shock and death: heart rate >100 beats/min, S1Q3T3 pattern, complete right bundle branch block (RBBB), inverted T waves in V1-V4, ST elevation in aVR, and atrial fibrillation.119
The presence of atrial arrhythmias, complete right bundle branch block, peripheral low voltage, pseudo-infarction pattern (Q waves) in leads III and aVF, and ST segment changes (elevation or depression) over the left precordial leads, were associated with a fatal outcome on admission (Figure 5). Twenty-nine percent of the patients who exhibited at least one of these abnormalities on admission did not survive hospital discharge, as opposed to only 11% of the patients without a pathological ECG.120
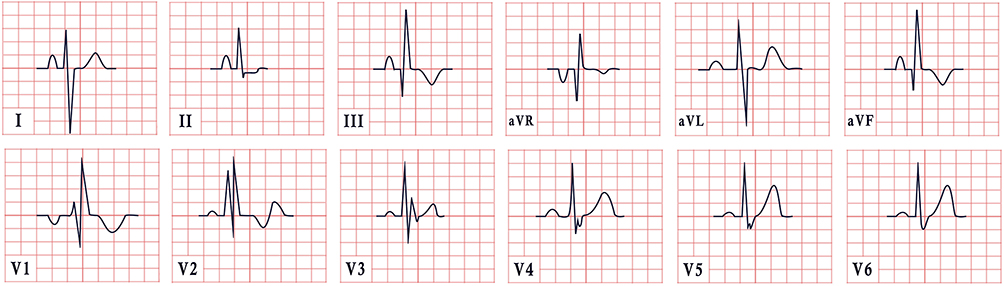 |
Figure 5 ECG features in pulmonary embolism. The ECG depicts the well-known S1Q3T3 pattern: S wave in lead I, Q wave in lead II and T-wave inversion in lead III. There is also right bundle branch block and pseudo-infarction pattern (Q waves in leads III, aVF). |
ECG Features in Pulmonary Diseases
The main pathogenic mechanism underlying ECG changes in lung disease involves organ hyperinflation and long-term effects of hypoxic pulmonary vasoconstriction on the right side of the heart. Such patients develop pulmonary hypertension and subsequent right atrial and right ventricular hypertrophy (ie, cor pulmonale). At this point, patients can experience atrial and ventricular dysrhythmias due to right ventricular hypertrophy/dilatation.121
The most classical signs of the burden imposed on the right heart are verticalization of the P-wave vector due to increase in atrial volume and mass, changes in QRS amplitude and duration due to emphysema, and axial shifts due to right ventricle mass increase. These changes in amplitude can be mainly attributed to the increased electrical resistance induced by the presence of air-filled bullae, as well as to a flattened diaphragm, now oriented more posteriorly, affecting the position of the heart (Figure 6). 121–124 However, a number of other possible changes pertaining to chronic lung hyperinflation are listed in (Table 1).
 |
Table 1 ECG changes in chronic lung hyperinflation |
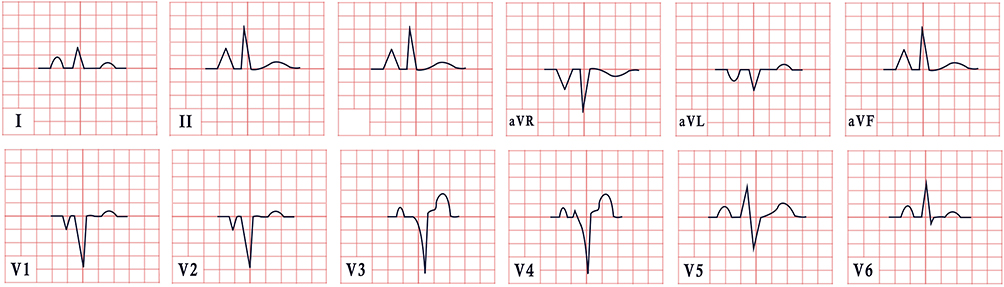 |
Figure 6 ECG features in pulmonary disease. The tracing illustrates sinus rhythm with a typical manifestation of P-pulmonale, particularly visible in leads II, III, aVR aVF, and V1-V2. |
ECG signs of chronic cor pulmonale are considered one of the poor prognostic signs of chronic obstructive pulmonary disease and should be closely monitored.125,126 An S1S2S3 pattern and right atrial overload during oxygen therapy are strong predictors of death, with a hazard ratio of, respectively, 1.81 (95% CI, 1.22 to 2.69), and 1.58 (95% CI, 1.15 to 2.18).127 Other important prognostic ECG markers are left and right bundle branch blocks. In a multivariable logistic regression model, patients with LBBB had a two-fold higher chance of death compared to those without left bundle branch block (LBBB). Conversely, the presence of RBBB conferred a 1.6 times lower chance of death during the observation period.128,129
Other obstructive lung diseases usually have a similar ECG pattern due to lung hyperinflation as a common pathogenic mechanism and positional changes of the heart. In acute settings, such as asthma exacerbation, the main changes subject to close monitoring are ST segment depression, T wave inversion and sinus tachycardia. They are present in up to 30% of patients and may portend a poor prognosis. These abnormalities persist for up to 7–9 days and often remain unexplained.130–133
ECG Features in Electrolyte Disturbances
Cardiac action potential is dependent on the activity of voltage-gated ion channels. Electrolyte disturbances are classically associated with abnormalities in cardiac electric activity. Changes in the concentration of serum and extracellular ions can lead to proarrhythmogenic or antiarrhythmogenic effects. While potassium is often viewed as a crucial electrolyte in regulating the electrical activity of the heart, other electrolytes such as sodium, calcium, magnesium may also result in changes in heart rhythm that are detectable by an ECG (Table 2, Figure 7).
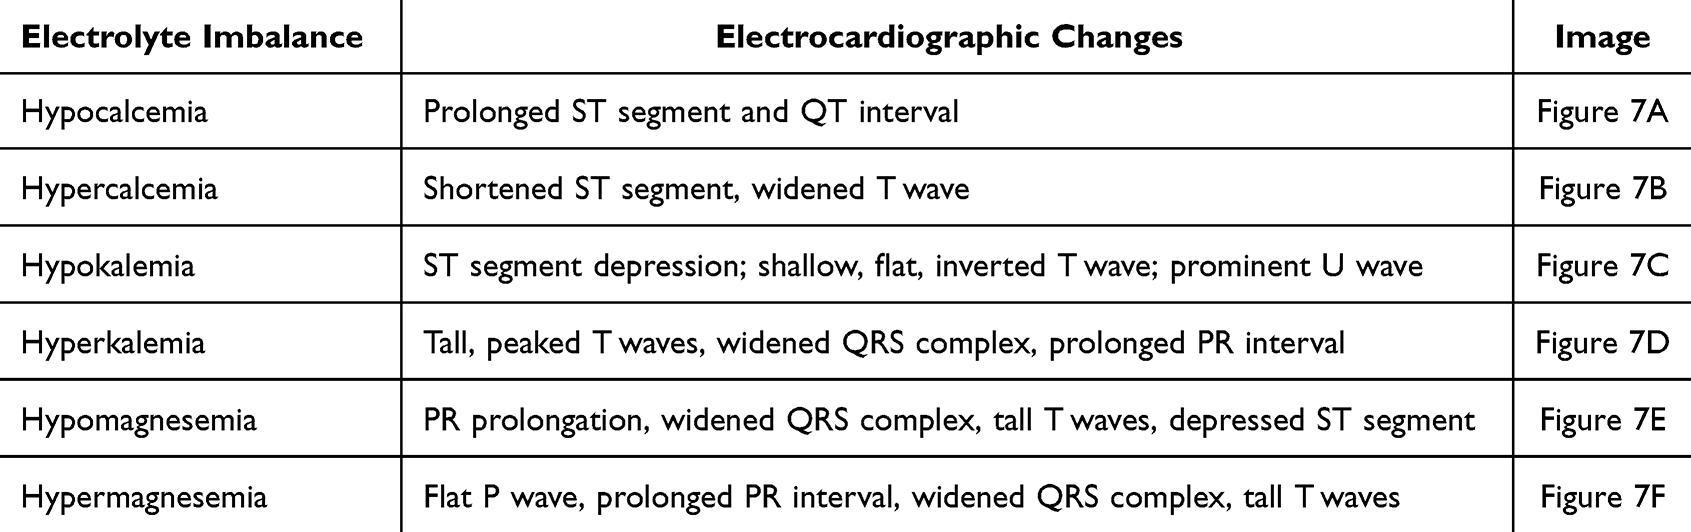 |
Table 2 Classical ECG changes in electrolyte disturbances |
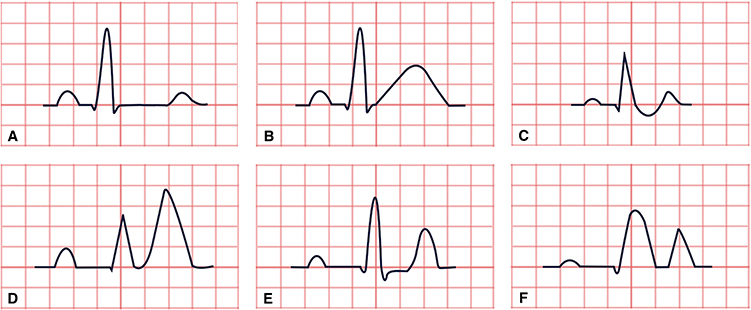 |
Figure 7 Classical ECG changes in electrolyte disturbances. (A) Hypocalcemia. (B) Hypercalcemia. (C) Hypokalemia. (D) Hyperkalemia. (E) Hypomagnesemia. (F) Hypermagnesemia. |
Potassium
The normal reference values in adults for potassium concentration range between 3.5 and 5.2 mmol/L. Hyperkalemia and hypokalemia strongly correlate with the frequency of rhythm abnormalities, as the potassium concentration gradient determines the myocardial membrane potential.134 Electrical disturbances usually manifest in a dose-dependent fashion (Table 3).
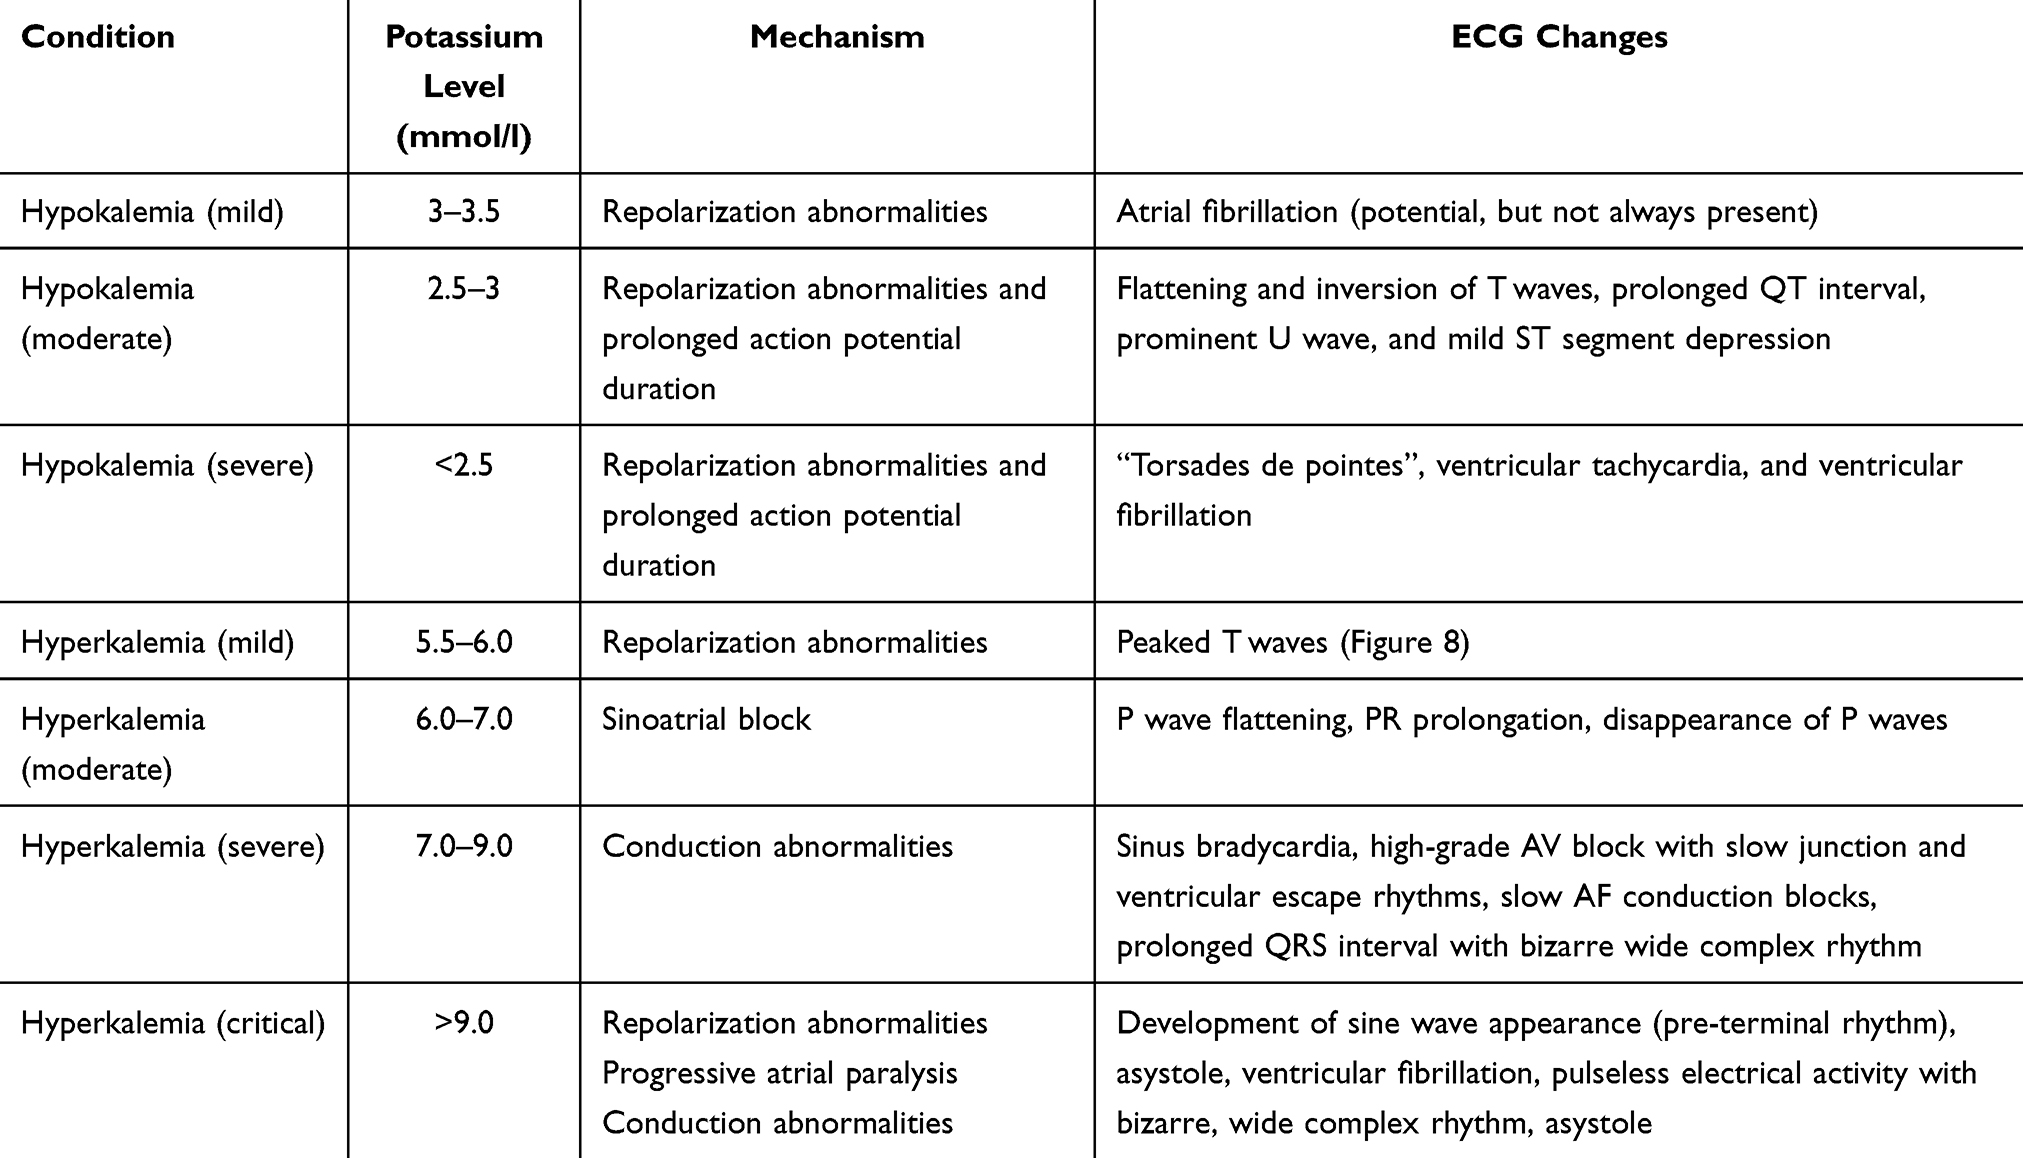 |
Table 3 Potassium level and ECG changes |
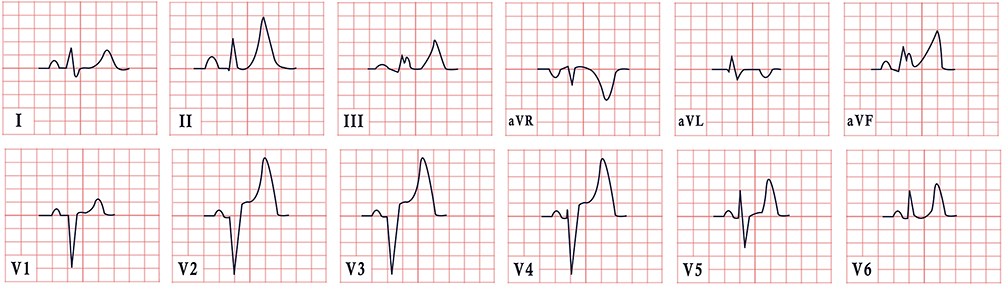 |
Figure 8 ECG features in hyperkalemia, revealing sinus rhythm, normal cardiac axis, prominent peaked T waves in leads II, III, aVF, V2-V6 and a widened QRS complex. |
Hyperkalemia is most commonly associated with a number of conditions such as chronic and acute renal failure, potassium supplementation for diuretic therapy, diuretic therapy with potassium-sparing drugs (spironolactone and triamterene), therapy with angiotensin-converting enzyme inhibitors or angiotensin receptor blockers, digitalis toxicity, and massive hemolysis during trauma.135
However, it is important to mention that not all patients with potassium shifts develop electrocardiographic abnormalities. Approximately 46% of patients with potassium levels greater than 6.0 mmol/l present electrocardiographic changes, and only 55% of patients with potassium levels greater than 6.8 mmol/l have changes consistent with hyperkalemia.136 In the early stages of mild hyperkalemia, myocytes exhibit increased excitability, leading to a shortened repolarization time. This is evidenced by manifestations such as ST segment depression, a reduction in QT interval duration, and the appearance of peaked T waves. As hyperkalemia progresses, impulse conduction diminishes, leading to prolonged PR and QRS intervals and atrioventricular conduction blocks (Figure 8). Finally, severe hyperkalemia can be fatal, either by inducing ventricular fibrillation or leading to asystole.137,138
Hypokalemia (K+<3.5 mmol/L) is associated with an increased risk of arrhythmia that requires medical treatment and primarily associated with a higher risk for atrial fibrillation.139,140 In cases of severe hypokalemia (K+<3 mmol/l), the T-wave may be masked by a giant U-wave, and the Q-U interval might be mistaken for a pseudo-prolonged QT-interval. Eventually, it can result in ventricular tachycardia or fibrillation, conduction blocks, and tachyarrhythmias (Figure 9). 141–143
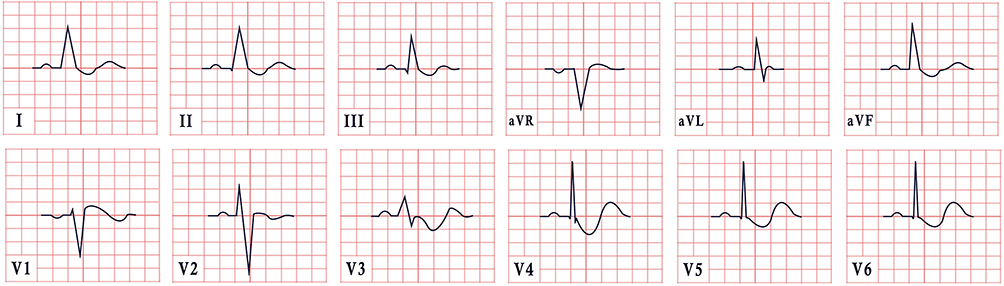 |
Figure 9 ECG features in hypokalemia. This ECG depicts sinus rhythm, normal cardiac axis, widespread ST segment depression, associated with T wave inversion and the presence of U waves. |
Calcium
Hypercalcemia and hypocalcemia primarily affect the action potential duration. In hypercalcemia, the QT interval tends to shrink, as elevated extracellular calcium levels have a stabilizing effect on the membrane, requiring a greater extent of depolarization to initiate an action potential.144,145 Conversely, in hypocalcemia, the QT interval is typically prolonged. While ECG abnormalities associated with hypercalcemia are generally less frequent than those seen in hypocalcemia, they frequently present as bradyarrhythmias. This is attributed to the prolongation of both PR and QRS intervals (by 12 and 7 milliseconds, respectively), along with the concurrent shortening of the QT interval (by 24 milliseconds). Additionally, patients with hypercalcemia often demonstrate an increased incidence of J waves, alongside Brugada-type ECG findings and early repolarization. ST segment elevation, biphasic T waves, and prominent U waves may also be observed. T wave alterations, resembling those seen in ischemia, can manifest in hypercalcemia and typically resolve with normalization of serum calcium levels.146,147
Magnesium
Normal serum magnesium concentrations range between 2.06 and 2.33 mg/dL. Abnormal levels can be ranked as: symptomatic hypomagnesemia (4.86 mg/dL).148,149
There are no ECG changes typical of hypomagnesemia or hypermagnesemia. However, in some cases, hypomagnesemia can be associated with shortened QRS interval (with a mean of 85 ms), a prolonged QTc interval (with a mean of 439 ms), tall T waves and downsloping ST segment, whereas in hypermagnesemia, prolonged PR interval and widened QRS complexes can occasionally be seen. Hypomagnesemia is also implicated in the onset of supraventricular and ventricular arrhythmias. Patients with lower serum magnesium concentrations (≤1.9 mg/dL) have a higher risk of developing atrial fibrillation compared to those with magnesium levels in the upper normal limit.150,151
ECG Features in Anemia
Anemia, commonly associated with chronic diseases, stands as an independent risk factor for cardiovascular disorders. Even a slight decrease in hemoglobin levels, by 1 g/dL, poses a significant risk for cardiac morbidity and mortality. The electrocardiogram (ECG) configuration is known to be influenced by anemia, with changes speculated to arise from an imbalance between myocardial oxygen supply and demand. According to various studies, electrocardiographic abnormalities in anemia lack specific features, with their prevalence ranging widely from 10% to 80%.152–156
Tachycardia and increased cardiac output are hyperdynamic conditions associated with decreased blood viscosity and peripheral vasodilation, constituting some of the cardiovascular compensatory effects of anemia. Anemic individuals show reduced basal parasympathetic outflow, leaving sympathetic activity unopposed and resulting in elevated heart rate. Therefore, tachycardia in anemic patients may be caused by decreased basal parasympathetic output, leading to increased cardiac output.157
There is a wide range of reports presenting varying perspectives on ECG changes observed in anemia.158 Particularly noteworthy are findings such as ST segment depression, T wave inversion, QT interval prolongation, and reduced QRS complex amplitude.159 The severity of anemia may correlate with alterations in the ECG.160 In severe anemia, typified by hemoglobin levels below 6 g/d, ECG changes may disclose rightward T-wave axis shift, longer PR interval duration, tachycardia and diminished QRS amplitude.154 A lengthened QT interval duration above 450 ms, is a risk factor for sudden cardiac death and ventricular arrhythmias. Hypoxia and reduced myocardial oxygen supply are likely the pathophysiological links between anemia and extended QT intervals. In hypertensive patients, macrocytosis – a precursor of anemia – and anisocytosis are similarly associated with protracted QT intervals. In non-pregnant females with severe iron deficiency anemia, there were positive relationships between serum ferritin, hemoglobin, and QTc.161
In patients with coronary heart disease and anemia, Bindra et al documented both supraventricular (sinus tachycardia, atrial premature contractions, and atrial fibrillation) and ventricular (ventricular premature contractions, ventricular tachycardia, and ventricular fibrillation) arrhythmias. According to these authors, patients with reduced hemoglobin, iron, and total iron-binding capacity were more likely to experience ventricular than supraventricular arrhythmias.162
The severity of anemia was influenced by both gender and age, with anemia becoming more severe with advancing age and in female sex.156,163 Khatri et al demonstrated a substantial correlation between increasing heart rate and anemia severity. The existence of ST segment abnormalities, T wave modifications, and a longer QT interval were all closely correlated with the anemia severity.156
Multiple research efforts have demonstrated that anemia contributes to higher morbidity and death in patients over the age of 70. Its prevalence rises with age, approaching 50% in chronically ill patients residing in nursing homes. The capacity to recognize and track people at higher risk may be enhanced by the growing application of algorithms generated by artificial intelligence. In a Korean retrospective study, the integration of a vast amount of electrocardiographic data enabled the diagnosis of anemia beyond clinical assessment by the physicians.154
ECG Features in Pregnancy
While pregnancy is a physiological phenomenon, it exerts profound effects on all maternal body functions, particularly leading to significant changes in the cardiovascular system. The circulatory variations and numerous physiological adaptations during normal pregnancy often impact physical findings, occasionally resulting in misdiagnoses of heart diseases. Additionally, pregnancy induces alterations in the ECG, which may be mistaken for cardiac abnormalities.164,165 Since the inception of electrocardiography, the impact of normal pregnancy on the ECG has been a subject of considerable interest.166
Pregnant women had more prominent Q waves in leads II, III, and aVF, as well as T-wave abnormalities such as flat and inverted T-waves in leads III, V1-V3. Given the significant variability of the ECG during normal pregnancy, the clinical meaning of a change in the electrical axis of the heart, as well as Q wave and T-wave abnormalities, must be regarded with caution.167
Variations in chamber size, particularly left atrial enlargement, can stretch and stress the cardiac conduction pathways, predisposing to changes in heart rhythm. A common finding in such setting is supraventricular tachycardia and ventricular ectopic complexes.20,168
Arrhythmias may occur for the first-time during pregnancy or may either become more severe in women previously diagnosed with arrhythmias.169 Pregnancy-induced hemodynamic alterations have been thoroughly investigated, and these changes are believed to contribute to the appearance of heart rhythm abnormalities. The increase in intravascular volume can beget overload of atrial and ventricular chambers and a transient increase in their size.170
Palpitations frequently occur during pregnancy and are a common reason for seeking consultation with a cardiologist. They span a wide range of possible causes, and the diagnostic approach is the same regardless of pregnancy status. Paroxysmal supraventricular tachycardia is a type of tachycardia caused, in most cases, by reentry within the atrioventricular (AV) node or by the use of an accessory route. During pregnancy, focal atrial tachycardia is unusual. Although frequently related with structural heart disease in nonpregnant women, most events of atrial tachycardia during pregnancy have been documented in patients without evidence of structural heart disease.171
In pregnant women presenting with atrial fibrillation, it is recommended to conduct an ECG, electrolyte assessment, urine drug screen, thyroid tests, and echocardiogram. Following rate control, the ECG can confirm the diagnosis of atrial fibrillation and detect underlying conditions such as Wolff-Parkinson-White syndrome.172,173
While nonsustained ventricular arrhythmias affect up to 50% of pregnant women, the clinical risk is minor in people with structurally normal hearts. Ventricular tachycardia (VT) has been reported in several cardiomyopathies during pregnancy, including hypertrophic cardiomyopathy and arrhythmogenic right ventricular cardiomyopathy. In this group of patients, ischemic cardiomyopathy is rare; however, myocardial infarction exacerbated by VT/ventricular fibrillation with or without (coronary dissection, spasm) coronary artery disease has been documented. Peripartum cardiomyopathy, arrhythmogenic right ventricular dysplasia, congenital long QT syndrome, hypertrophic cardiomyopathy, and, in rare cases, coronary artery disease, including coronary artery spasm or abnormality, can all cause VT in a pregnant patient.174
If documentation of tachycardia is available on a tracing, it is often noticeable that the arrhythmia frequently begins with a rapid prolongation of the PR interval. When P waves can be readily distinguished, the P wave axis is aberrant due to retrograde atrial activation. On the ECG, this is commonly seen as a negative P wave axis with inverted P waves in leads II, III, and aVF.175
Significant ST segment depression during tachycardia has been observed in 25 to 50% of patients with AV nodal reentrant tachycardia (AVNRT), though it is more common in those with AV reentrant tachycardia associated with an accessory pathway. T wave inversions in the anterior or inferior leads may be found in roughly 40% of patients after acute termination of AVNRT and other paroxysmal supraventricular tachycardias.176
Women with long QT syndrome are predisposed to VT, particularly in the postpartum period. Pregnant women with long QT syndrome should be treated with beta blockers throughout their pregnancy and after delivery.177
During the antepartum period, sinus bradycardia is rare. Normal pregnancy-related physiologic heart rate increases range from 10 to 20 beats/min above baseline. Mild sinus bradycardia may develop transiently after normal delivery and last for a few days postpartum. In the absence of structural cardiac disease, sinus bradycardia rarely causes symptoms and requires no treatment.178
Women with structural heart disease, such as rheumatic or congenital heart disease, may experience first-degree AV block. Transient AV block caused by elevated vagal tone is expected to be less common in pregnant women than in nonpregnant women. It is unknown how common first-degree AV block is. The site of AV delay is usually located in the atrioventricular node, above the bundle of His, and it rarely progresses to advanced heart block.178
Second-degree AV block can occur during pregnancy. Mobitz type I (Wenckebach) AV block is more prevalent and has a better prognosis. As a result, a conservative clinical monitoring strategy is recommended. Mobitz Type II block, often occurring below the AV node, may precede the development of complete infra-His AV block. It is rare during pregnancy and more common in women with structural heart disease. AV block below the His bundle is typically associated with a very slow or nonexistent ventricular escape rhythm, resulting in hemodynamic impairment and/or syncope.179
Monitoring strategy. Women with first-degree AV block should get an electrocardiogram upon attending the clinic. They do not require ambulatory ECG monitoring or telemetry during pregnancy or labor and delivery. Mobitz type II and total heart block with narrow QRS must be managed individually, depending on the presence of structural heart disease and the patient’s clinical condition. The frequency of ambulatory ECG monitoring is determined by the women’s symptom status and the underlying heart problem. Women who have syncope and severe AV block should be admitted to the hospital for monitoring and evaluation for pacemaker placement. Women with Mobitz type II or complete heart block should have continuous telemetry monitoring during labor and delivery. Because some women may develop postpartum bradycardia, monitoring should be continued in the immediate postpartum period while in the hospital. Ambulatory ECG monitoring is indicated after hospital discharge because some women with newly detected conduction block in pregnancy may experience remission after labor. When reading an ECG of a pregnant woman, one must be aware that at any stage of pregnancy, left axis deviation and tall Q waves are common findings, as opposed to ectopic QRS complexes, which are infrequent. The obstetrician must ensure that the cardiac patient is properly monitored and that the extra demands of pregnancy are fulfilled adequately in order to warrant a healthy heart status throughout pregnancy.180,181 In addition, specific ECG modifications occur in each trimester of pregnancy. During the first trimester, the following ECG alterations are observed: PR interval: 0.12–0.18 seconds, QRS duration: 0.06–0.09 seconds, QTc: 396–440 ms, and P-wave dispersion: 0–0.04 seconds. In the second trimester, the axis may be normal or exhibit left axis deviation, PR interval: 0.1–0.2 seconds, QRS duration: 0.06–0.09 seconds, QTc: 373–444 ms and P-wave dispersion: 0–0.04 seconds. Finally, during the third trimester, the axis can similarly be normal or demonstrate left axis deviation, PR interval: 0.1–0.2 seconds, QRS duration: 0.06–0.09 seconds, QTc: 371–430 ms and lastly, P-wave dispersion: 0–0.04 seconds.164
ECG Features in Coronavirus Disease 2019 (COVID-19)
COVID-19 originated in China and rapidly spread worldwide.182 Since the initial documentation of the pandemic, a considerable volume of data concerning the diverse implications of the disease has accumulated in medical literature. Among the reported manifestations or complications in COVID-19 patients, cardiac arrhythmias are commonly observed. In the ever-evolving landscape of COVID-19 research, one area that has captured the interest of medical professionals and researchers alike is the analysis of ECG changes in patients infected by severe acute respiratory syndrome-related coronavirus 2 (SARS-CoV-2) virus. This intriguing facet of the disease has shed light on its potential impact on the cardiovascular system. ECG changes can be used to predict disease severity and outcomes as well as clinical course of the disease. Also, it seems that the viral strain responsible for the infection is important regarding onset and evolution of myocardial injury manifested in COVID-19.183,184
One of the ECG changes in COVID-19 is known as transmural dispersion of repolarization of the left ventricle. This ECG parameter represents the interval measured from the electrocardiographic T wave peak to its end (Tp-e) and it has been considered a better marker of repolarization disturbances and even myocardial fibrosis. Another ECG measurement aimed at evaluating ventricular repolarization in COVID-19 is Tp-e/QTc ratio, which seems to be associated with disorders of the conduction system. Both Tp-e interval and Tp-e/QT ratio reflect phenomena related to ventricular repolarization. A prolongation of the TpTe and an increase in TpTe/QT ratio in patients affected by COVID-19 may be explained by the influence of endogenous and exogenous mediators over the M-cells, leading to disturbances in the duration of their repolarization.185
In patients with mild and moderate COVID-19, a new bundle branch block or a change in QRS morphology and amplitude secondary to changes in rhythm origin does not seem to correlate with in-hospital mortality. Conversely, other authors suggested that in critically ill patients, the amplitude of the QRS complex appeared to be an independent predictor of mortality.186
Furthermore, a parameter known as index of cardiac electrophysiological balance (iCEB) serves as a useful, innovative prognostic marker for arrhythmic events and cardiovascular complications. iCEB is determined by the ratio of the QT interval to the QRS duration (QT/QRS), and when increased or decreased, it may raise the suspicion of a disturbance in depolarization and/or repolarization. Such deviations pose a substantial risk of “torsades de pointes” or ventricular tachycardia and fibrillation, accordingly.187
Cardiac arrhythmias during COVID-19 can be attributed to direct and indirect effects of the virus onto the cardiac myocytes, leading to electrical disturbances that underlie the expression of various arrhythmias. Other possible explanations for the myriad of cardiac arrhythmias related to COVID-19 lie in the myocardial stress caused by metabolic and electrolyte abnormalities, as well as inflammation of cardiomyocytes, increased catecholamine release, and effects of hypoxia.188
Increased QT interval longer than 120 ms is considered one of the major ECG changes in COVID-19. One of the explanations for QT prolongation in patients with COVID-19 points towards the systemic inflammation that widens QTc via cytokine-mediated effects on potassium channel expression, followed suit by prolongation of the action potential leading to increased QTc interval. Furthermore, QT prolongation may be associated to the direct viral effect over the myocardium, since some strains have reportedly been responsible for prolonging QT interval.189 A prolonged QT interval may be a marker for mortality in COVID-19 patients. Abrahams et al found that patients who died from COVID-19 were more likely to show prolonged QT interval at admission.190 Hydroxychloroquine is also a well-known cause of QT prolongation, presumably related to some deaths during the early times of the pandemic, when its widespread use had not yet been doomed by evidence of harm. QT prolongation has also been associated with increased plasma levels of troponin, COVID-19 severity, and higher mortality.191 QT prolongation may be observed in patients with COVID-19 regardless of the use of hydroxychloroquine.192
Ventricular arrhythmias may occur in patients with COVID-19. They can be triggered and perpetuated by viral direct myocardial damage, systemic endothelial dysfunction, inflammation, catecholaminergic response to stress, adverse effects of various medications as well as deterioration of the underlying clinical condition.193
A Prolonged QRS interval could be explained by the active myocardial injury due to the penetration of SARS-CoV-2 in the cell and its multiplication. Though the exact mechanism is unclear, QRS prolongation may be due to direct cardiomyocyte infiltration by the virus, which in turn may disrupt the membrane gap junctions and foster conduction system dysfunction. Moreover, cytokines may also play a key role in QRS prolongation due to their direct effect on action potential duration.193
ST-T changes are common in COVID-19, reflecting myocardial injury through mechanisms such as direct viral damage to cardiomyocytes and systemic inflammation. Studies by Angeli et al and Barman et al showed associations between ST-T abnormalities, left ventricular hypertrophy, and the severity of COVID-19, indicating a potential prognostic value.194,195
New widespread concave ST elevation and PR depression in limb leads (I, II, III, aVL, aVF) may suggest COVID-19-induced pericarditis, possibly mediated by the shifting of angiotensin-converting enzyme II receptors in epicardial fat. Pericarditis could contribute to local inflammation and atrial fibrillation, although systemic inflammation and intoxication in COVID-19 may independently trigger atrial fibrillation.196–198
Cornell voltage, an indicator of left ventricular hypertrophy (LVH) can be determined by the sum of R wave in lead aVL and S wave in lead V3. A sum greater than 28 mm in males or greater than 20 mm in females denotes LVH. In some cases, Cornell voltage decrease is observed in COVID-19 patients. This change can be explained by the presence of epicardial edema, pleural or pericardial effusions, and electrical and/or conduction disturbances associated with tachyarrhythmias during COVID-19.194
Other ECG changes such as atrial fibrillation, atrial flutter, sinus tachycardia and AV block were most frequently found among hospitalized patients with COVID-19. The higher prevalence of atrial fibrillation and flutter may be explained by the release of cardiac troponins reflecting cardiac injury, which in turn might exacerbate myocardial electrical destabilization and ease re-entry mechanisms. Atrial flutter and fibrillation, as well as AV block and sinus tachycardia, might also result from myocardial ischemia, left ventricular systolic and/or diastolic dysfunction, pulmonary embolism, acute respiratory distress syndrome and even a direct action of the virus upon the conduction system.191,199
Supraventricular arrhythmias are also frequently documented in COVID-19 patients. A recent systematic review and meta-analysis revealed a 10.3% prevalence of overall ECG abnormalities among COVID-19 patients. According to the authors, the most commonly reported arrhythmias during hospitalization were supraventricular arrhythmias in 6.2% followed by ventricular arrhythmias in 2.5% of patients.200
Sinus tachycardia, a very frequent ECG finding in COVID-19 may result from several stimuli, among which, higher levels of stress imposed by viral toxins and sepsis, hypovolemia, pulmonary embolism, mechanical ventilation, and psychological disturbances.191
Conclusions
Since most of the aforementioned diseases potentially impacting the ECG morphology are evaluated by non-cardiologist physicians, there may be higher odds of misinterpretation of the ECG, even more so in the presence of non-specific abnormalities. Although typical ECG findings are more likely to be promptly recognized, significant error rates involving ECG analysis could lead to potentially devastating consequences.
This review emphasizes the multifaceted usefulness of the ECG, extending its significance beyond the diagnosis of typical cardiovascular diseases. While there are ECG changes highly indicative of certain diseases, such as hyperkalemia, the ECG may also present with various nonspecific findings in other conditions. It is crucial to acknowledge that these patterns might be occasionally mistaken for more severe conditions, prompting the elaboration of a necessary and adequate differential diagnosis. Such important examples are the presence of ST segment changes and T wave inversion, which could mirror a variety of non-cardiac related disorders, as well as the presence of acute coronary syndrome or a combination of both. A comprehensive understanding of potential mimics and similar patterns is essential for clinicians across different specialties, in order to conduct proper and accurate investigations, to ensure precise diagnoses, and avoid unnecessary downstream exams. Physicians must familiarize themselves with diverse ECG patterns, as this knowledge proves beneficial not only for diagnosing cardiovascular conditions but also for managing a variety of other non-cardiac diseases and potentially saving costs down the line.
Disclosure
Alexandr Ceasovschih, Serghei Covantsev, Anastasia Balta, Jamol Uzokov, Raluca Ecaterina Haliga and Alexandra Stoica have the same contribution as the first author for this study. The authors report no conflicts of interest in this work.
References
1. Gore M, Bansal K, Khan Suheb MZ. Asuncion RMD: Lacunar Stroke. Treasure Island (FL): StatPearls Publishing; 2023.
2. Ustrell X, Pellisé A. Cardiac workup of ischemic stroke. Curr Cardiol Rev. 2010;6(3):175–183.
3. Omisore AD, Ayoola OO, Ibitoye BO, Fawale MB, Adetiloye VA. Sonographic Evaluation of Endothelial Function in Brachial Arteries of Adult Stroke Patients. J of Ultrasound Medicine. 2017;36(2):345–351.
4. Sacco RL, Kasner SE, Broderick JP, et al. An updated definition of stroke for the 21st century: a statement for healthcare professionals from the American Heart Association/American Stroke Association. Stroke. 2013;44(7):2064–2089.
5. Kuriakose D, Xiao Z. Pathophysiology and treatment of stroke: present status and future perspectives. Int J Mol Sci. 2020;21(20):7609.
6. Owolabi M, Ogbole G, Akinyemi R, et al. Development and reliability of a user-friendly multicenter phenotyping application for hemorrhagic and ischemic stroke. J Stroke Cerebrovasc Dis. 2017;26(11):2662–2670.
7. Katsanos AH, Korantzopoulos P, Tsivgoulis G, Kyritsis AP, Kosmidou M, Giannopoulos S. Electrocardiographic abnormalities and cardiac arrhythmias in structural brain lesions. Int J Cardiol. 2013;167(2):328–334.
8. Christensen H, Boysen G, Christensen A, Johannesen H. Insular lesions, ECG abnormalities, and outcome in acute stroke. J Neurol Neurosurg Psychiatry. 2005;76(2):269–271.
9. Sethuraman M, Hrishi AP, Prathapadas U, et al. Electrocardiographic changes in patients with raised intracranial pressure from supratentorial brain tumors. JNRP. 2023;14(1):55.
10. Balta A, Ceasovschih A, Șorodoc V, et al. Broad Electrocardiogram Syndromes Spectrum: from Common Emergencies to Particular Electrical Heart Disorders. J Pers Med. 2022;12(11):1754. doi:10.3390/jpm12111754
11. Chen Z, Venkat P, Seyfried D, Chopp M, Yan T, Chen J. Brain–heart interaction: cardiac complications after stroke. Circ Res. 2017;121(4):451–468. doi:10.1161/CIRCRESAHA.117.311170
12. Scheitz JF, Nolte CH, Doehner W, Hachinski V, Endres M. Stroke–heart syndrome: clinical presentation and underlying mechanisms. Lancet Neurol. 2018;17(12):1109–1120.
13. Mitro P, Šimurda M, Lazúrová Z, Jakubová M. Etiology of syncope in patients with preexisting atrioventricular conduction disorders. Pacing Clin Electrophysiol. 2020;43(11):1268–1272.
14. Khechinashvili G, Asplund K. Electrocardiographic changes in patients with acute stroke: a systematic review. Cerebrovasc Dis. 2002;14(2):67–76.
15. Pescador Ruschel MA, De Jesus O. Migraine Headache. Treasure Island (FL): StatPearls Publishing; 2023.
16. Akerman S, Holland PR, Goadsby PJ. Diencephalic and brainstem mechanisms in migraine. Nat Rev Neurosci. 2011;12(10):570–584.
17. Miglis MG. Migraine and autonomic dysfunction: which is the horse and which is the jockey? Curr Pain Headache Rep. 2018;22:1–7.
18. Aygun D, Altintop L, Doganay Z, Guven H, Baydin A. Electrocardiographic changes during migraine attacks. J Headache Pain. 2003;43(8):861–866.
19. Wayne V. A possible relationship between migraine and coronary artery spasm. Aust N Z J Med. 1986;16(5):708–710.
20. Clark E. Serum carditis: the morphologic cardiac alterations in man associated with serum disease. JAMA. 1938;110(14):1098–1100.
21. Kounis N, Zavras G. Histamine-induced coronary artery spasm: the concept of allergic angina. Br J Clin Pract. 1991;45(2):121–128.
22. Sueda S, Sasaki Y, Habara H, Kohno H. Kounis syndrome (allergic angina and allergic myocardial infarction) for cardiologists. J Cardiol Cases. 2015;12(4):110–112.
23. Biteker M. A new classification of Kounis syndrome. Int J Cardiol. 2010;145(3):553.
24. Gázquez V, Dalmau G, Gaig P, Gómez C, Navarro S, Mercé J. Kounis syndrome: report of 5 cases. J Investig Allergol Clin Immunol. 2010;20(2):162–165.
25. Lionte C. An unusual cause of hypotension and abnormal electrocardiogram (ECG)—scombroid poisoning. Cent Eur J Med. 2010;5:292–297.
26. Forzese E, Pitrone C, Cianci V, et al. An Insight into Kounis Syndrome: bridging Clinical Knowledge with Forensic Perspectives. Life. 2024;14(1):91.
27. Kogias JS, Papadakis EX, Tsatiris CG, et al. Kounis syndrome: a manifestation of drug-eluting stent thrombosis associated with allergic reaction to contrast material. Int J Cardiol. 2010;139(2):206–209.
28. González-de-Olano D, Alvarez-Twose I, Matito A, Sanchez-Munoz L, Kounis N, Escribano L. Mast cell activation disorders presenting with cerebral vasospasm-related symptoms: a “Kounis-like” syndrome? Int J Cardiol. 2011;150(2):210–211.
29. Schwartz H, Yunginger J, Schwartz L. Is unrecognized anaphylaxis a cause of sudden unexpected death? Clin Exp Allergy. 1995;25(9):866–870.
30. Salari H, Chan-Yeung M. Mast cell mediators stimulate synthesis of arachidonic acid metabolites in macrophages. J Immunol. 1989;142(8):2821–2827.
31. Şaylan B, Cevik A, Firat C. Kounis syndrome, a cause of chest pain to keep in mind, may be associated with E148Q mutation. J Emerg Crit Care Med. 2012;19(4):278–282.
32. Gilfillan AM, Tkaczyk C. Integrated signalling pathways for mast-cell activation. Nat Rev Immunol. 2006;6(3):218–230.
33. Coppola G, Caccamo G, Bacarella D, et al. Vasospastic angina and scombroid syndrome: a case report. Acta Clin Belg. 2012;67(3):222–225.
34. Johnson JL, Jackson CL, Angelini GD, George SJ. Activation of matrix-degrading metalloproteinases by mast cell proteases in atherosclerotic plaques. Arterioscler Thromb Vasc Biol. 1998;18(11):1707–1715.
35. Allen S, Dashwood M, Chester A, et al. Influence of atherosclerosis on the vascular reactivity of isolated human epicardial coronary arteries to leukotriene C4. Cardioscience. 1993;4(1):47–54.
36. Poggiali E, Benedetti I, Vertemati V, et al. Kounis syndrome: from an unexpected case in the Emergency Room to a review of the literature. Acta Biomed. 2022;93(1):567.
37. Fisher MM. Clinical observations on the pathophysiology and treatment of anaphylactic cardiovascular collapse. Anaesth Intensive Care. 1986;14(1):17–21.
38. Lippi G, Buonocore R, Schirosa F, Cervellin G. Cardiac troponin I is increased in patients admitted to the emergency department with severe allergic reactions. A case–control study. Int J Cardiol. 2015;194:68–69.
39. Muraro A, Roberts G, Worm M, et al. Anaphylaxis: guidelines from the European Academy of Allergy and Clinical Immunology. Allergy. 2014;69(8):1026–1045.
40. Abdelghany M, Subedi R, Shah S, Kozman H. Kounis syndrome: a review article on epidemiology, diagnostic findings, management and complications of allergic acute coronary syndrome. Int J Cardiol. 2017;232:1–4.
41. Kounis GN, Kouni SA, Hahalis G, Kounis NG. Mesalamine hypersensitivity and Kounis syndrome in a pediatric ulcerative colitis patient. World J Gastroenterol. 2008;14(46):7141.
42. Matta A, Elenizi K, Bouisset F, Roncalli J. Utility of enhanced cardiac magnetic resonance imaging in Kounis syndrome: a case report. Eur Heart J Case Rep. 2020;4(4):1–5.
43. Kounis NG. Kounis syndrome: an update on epidemiology, pathogenesis, diagnosis and therapeutic management. Clin Chem Lab Med. 2016;54(10):1545–1559.
44. Kounis NG, Koniari I, Soufras GD, et al. The humble relation of kounis syndrome, MINOCA (myocardial infarction with nonobstructive coronary arteries) and MACE (major adverse cardiac events). Can J Cardiol. 2018;34(8):1089. e7.
45. Kounis NG, Mazarakis A, Tsigkas G, Giannopoulos S, Goudevenos J. Kounis syndrome: a new twist on an old disease. Future Cardiol. 2011;7(6):805–824.
46. Cevik C, Nugent K, Shome GP, Kounis NG. Treatment of Kounis syndrome. Int J Cardiol. 2010;143(3):223–226.
47. Salouage I, El Aidli S, Kastalli S, Daghfous R, Lakhal M. Fatal Kounis syndrome with stent thrombosis secondary to amoxicillin/clavulanic acid use: a case report and literature review. Therapies. 2016;71(6):535–539.
48. Kitulwatte I, Gangahawatte S, Perera U, Edirisinghe P. Death following ceftazidime-induced Kounis syndrome. Med Leg J. 2017;85(4):215–218.
49. Moreno Diaz R. New Fatal Case of Kounis Syndrome Triggered by Metamizole: a Case Report. J Aesthet Reconstr Surg. 2018;4(2):12.
50. Buğdacı MS, Tüzün A, Koca H, Çavusoğlu T, Akyüz Ü, Şentürk H. QT interval changes and reversibility of QT dispersion in patients with acute pancreatitis. Turk J Gastroenterol. 2014;25(1):59–62.
51. Yegneswaran B, Kostis JB, Pitchumoni C. Cardiovascular manifestations of acute pancreatitis. J Crit Care. 2011;26(2):225. e11–225. e18.
52. Pădureanu V, Boldeanu MV, Streaţă I, et al. Determination of VEGFR-2 (KDR) 604A> G polymorphism in pancreatic disorders. Int J Mol Sci. 2017;18(2):439.
53. Bulava A, Skvarilová M, Marek O, Lukl J. Electrocardiographic changes in patients with acute pancreatitis. Case report and review of the literature. Vnitrni Lekarstvi. 2001;47(6):407–410.
54. Khan U, Petrechko O, Sagheer S, et al. Acute pancreatitis and myocardial infarction: a narrative review. Cardiology. 2023;148(1):1–11.
55. Sethi P, Murtaza G, Sharma A, Paul T. ST segment elevation with normal coronaries. Case Rep Med. 2016;2016:657.
56. Khairy P, Marsolais P. Pancreatitis with electrocardiographic changes mimicking acute myocardial infarction. Can J Gastroenterol Hepatol. 2001;15:522–526.
57. Rubio-Tapia A, García-Leiva J, Asensio-Lafuente E, Robles-Díaz G, Vargas-Vorácková F. Electrocardiographic abnormalities in patients with acute pancreatitis. J Clin Gastroenterol. 2005;39(9):815–818.
58. Long Y, Tang M, Wang J, et al. Case report: abnormal ECG in a patient with acute pancreatitis. Front Cardiovasc med. 2021;8:741253.
59. Lionte C, Sorodoc V, Bologa C, Tuchilus C, Jaba E. Usefulness of transthoracic echocardiography parameters and brain natriuretic peptide as mortality predictors in hospitalized acutely poisoned patients: a prospective observational study. Basic Clin Pharmacol Toxicol. 2017;120(5):498–504.
60. Costache II, Miron A, Hăncianu M, et al. Pharmacokinetic Interactions between Cardiovascular Medicines and Plant Products. Cardiovasc Ther. 2019;2019:9402781.
61. Lionte C, Bologa C, Sorodoc V, et al. Biomarkers of inflammation and inflammation-related indexes upon emergency department admission are predictive for the risk of intensive care unit hospitalization and mortality in acute poisoning: a 6-year prospective observational study. Dis Markers. 2021;2021.
62. Farzam K, Jan A. Beta Blockers. Treasure Island (FL): StatPearls Publishing; 2023.
63. Oliver E, Mayor F, D’Ocon P. Beta-blockers: historical perspective and mechanisms of action. Rev Esp Cardiol. 2019;72(10):853–862.
64. Tucker WD, Sankar P, Theetha Kariyanna P. Selective Beta-1 Blockers. Treasure Island (FL): StatPearls Publishing; 2023.
65. Marcu DTM, Adam CA, Dorobanțu DM, et al. Beta-Blocker-Related Atrioventricular Conduction Disorders-A Single Tertiary Referral Center Experience. Medicina (Kaunas). 2022;58(2):320.
66. Love JN, Enlow B, Howell JM, Klein-Schwartz W, Litovitz TL. Electrocardiographic changes associated with β-blocker toxicity. Ann Emerg Med. 2002;40(6):603–610.
67. Lionte C, Sorodoc V, Tuchilus C, Cimpoiesu D, Jaba E. Biomarkers, lactate, and clinical scores as outcome predictors in systemic poisons exposures. Hum Exp Toxicol. 2017;36(7):651–662.
68. McKeever RG, Hamilton RJ. Calcium Channel Blockers. 2022 Aug 5. Treasure Island (FL): StatPearls Publishing; 2023.
69. Costache II, Miftode E, Mitu O, Aursulesei V. Sex Differences in Cardiovascular Risk Factors in a Rural Community from North Romania Region. Rev Cercet Interv Soc. 2016;55:204–214.
70. Handler J. Dihydropyridine/nondihydropyridine calcium channel blocker combination therapy. J Clin Hypertens. 2005;7(1):50.
71. Elliott WJ, Ram CVS. Calcium channel blockers. J Clin Hypertens. 2011;13(9):687.
72. Bologa C, Lionte C, Coman A, Sorodoc L. Lipid emulsion therapy in cardiodepressive syndrome after diltiazem overdose–case report. Am J Emerg Med. 2013;31(7):1154. e3–4.
73. Chakraborty RK, Hamilton RJ. Calcium Channel Blocker Toxicity. Treasure Island (FL): StatPearls Publishing; 2023.
74. David MNV, Shetty M. Digoxin. Treasure Island (FL): StatPearls Publishing; 2023.
75. Djohan AH, Sia C-H, Singh D, Lin W, Kong WK-F, Poh -K-K. A myriad of electrocardiographic findings associated with digoxin use. Singapore Med J. 2020;61(1):9.
76. Negroni MS, Marengo A, Caruso D, et al. A case report of accidental intoxication following ingestion of foxglove confused with borage: high digoxinemia without major complications. Case Rep Cardiol. 2019;2019:567.
77. Anderson BJ. Paracetamol (Acetaminophen): mechanisms of action. Paediatr Anaesth. 2008;18(10):915–921.
78. Mahadeva S, Parekh N, Bosomworth M, Millson C, Berkin K, Bellamy M. Cardiac troponin I as a marker of myocardial injury in paracetamol induced acute liver failure. Crit Care. 2001;5(Suppl 1).
79. Sorodoc L, Lionte C, Laba V. A rare cause of non-Q myocardial infarction–acute carbon monoxide poisoning. Rev Med Chir Soc Med Nat Iasi. 2004;108(4):782–785.
80. Khabazianzadeh F, Kazemi T, Nakhaee S, Ng PC, Mehrpour O. Acetaminophen poisoning-induced heart injury: a case-based review. Daru. 2019;27:839–851.
81. Erglu M, Omer U, Zafer I, Yalcin M, Yildrim A, Kardesglu E. Carbon monoxide poisoning increase Tpeak-Tend dispersion and QTc dispersion. Cardiovasc J Afr. 2014;25:106–109.
82. Maready E, Holstege C, Brady W, Baer A. Electrocardiographic abnormality in carbon monoxide–poisoned patients. Ann Emerg Med. 2004;44(4).
83. Palaniswamy C, Aronow W, Sugunaraj JP, Kang JJ, Kar K, Kalra A. Brugada electrocardiographic pattern in carbon monoxide poisoning. Arch Med Sci. 2013;9(2):377–380.
84. Akdemir HU, Güngörer B, Çalışkan F, Colak S, Güzel M. Atrial fibrillation related to carbon monoxide poisoning in a female patient. Am J Emerg Med. 2014;32(9):1154. e3–5.
85. LaHood AJ, Kok SJ. Ethanol Toxicity. Treasure Island (FL): StatPearls Publishing; 2023.
86. Voskoboinik A, Prabhu S, L-h L, Kalman JM, Kistler PM. Alcohol and atrial fibrillation: a sobering review. J Am Coll Cardiol. 2016;68(23):2567–2576.
87. Ihekire NL, Okobi OE, Adedoye EA, et al. Heartache in a Bottle: understanding Alcoholic Cardiomyopathy. Cureus. 2023;15(8):547.
88. Sereny G. Effects of alcohol on the electrocardiogram. Circulation. 1971;44(4):558–564.
89. Raheja H, Namana V, Chopra K, et al. Electrocardiogram changes with acute alcohol intoxication: a systematic review. Open Cardiovasc Med J. 2018;12:1.
90. Aasebø W, Aasebø W, Erikssen J, Jonsbu J, Stavem K. ECG changes in patients with acute ethanol intoxication. Scand Cardiovasc J. 2007;41(2):79–84.
91. Nagesh I, Koley K, Sen S, Mohan S, Sahu S. Ethylene glycol poisoning. Med J Armed Forces India. 2015;71:S36–S38.
92. Leth PM, Gregersen M. Ethylene glycol poisoning. Forensic Sci Int. 2005;155(2–3):5677.
93. Bologa C, Ciuhodaru L, Coman A, et al. Unusual cause of spontaneous unilateral intracerebral hematoma-acute methanol poisoning: case report. Am J Emerg Med. 2014;32(9):1154.e1–2.
94. Suit PF, Estes ML. Methanol intoxication: clinical features and differential diagnosis. Cleve Clin J Med. 1990;57(5):464–471.
95. Dibajnia P, Sivilotti ML, Juurlink D, Shurrab M. ST-elevation in ethylene glycol toxicity mimicking myocardial infarction. J Electrocardiol. 2020;58:128–131.
96. Iqbal A, Glagola JJ, Nappe TM. Ethylene glycol toxicity. Am J Clin Pathol. 2019;45:46.
97. Denning D, Berendt A, Chia Y, Morgan S. Myocarditis complicating ethylene glycol poisoning in the absence of neurological features. Postgrad Med J. 1988;64(757):867–870.
98. Jaff Z, McIntyre WF, Yazdan-Ashoori P, Baranchuk A. Impact of methanol intoxication on the human electrocardiogram. Cardiol J. 2014;21(2):170–175.
99. Marrs TC, Maynard RL, Sidell FR, eds. Chemical Warfare Agents: Toxicology and Treatment. 1st ed. Wiley; 2007.
100. Ludomirsky A, Klein HO, Sarelli P, et al. Q-T prolongation and polymorphous (“torsade de pointes”) ventricular arrhythmias associated with organophosphorus insecticide poisoning. Am J Cardiol. 1982;49(7):1654–1658. doi:10.1016/0002-9149(82)90242-9
101. Ahishali E, Boynuegri B, Ozpolat E, et al. Approach to mushroom intoxication and treatment: can we decrease mortality? Clin Res Hepatol Gastroenterol. 2012;36(2):139–145. doi:10.1016/j.clinre.2011.11.004
102. Unverir P, Soner BC, Dedeoglu E, Karcioglu O, Boztok K, Tuncok Y. Renal and hepatic injury with elevated cardiac enzymes in Amanita phalloides poisoning: a case report. Hum Exp Toxicol. 2007;26(9):757–761. doi:10.1177/0960327107083972
103. Qin Z, Luo L, Ge L. Electrocardiogram of a patient with mushroom poisoning-induced myocarditis. Ann Noninvasive Electrocardiol. 2023;28(2):e13011. doi:10.1111/anec.13011
104. Erenler AK, Doğan T, Koçak C, Ece Y. Investigation of toxic effects of mushroom poisoning on the cardiovascular system. Basic Clin Pharmacol Toxicol. 2016;119(3):317–321. doi:10.1111/bcpt.12569
105. Thomsen JH, Hassager C, Bro-Jeppesen J, et al. Sinus bradycardia during hypothermia in comatose survivors of out-of-hospital cardiac arrest – a new early marker of favorable outcome? Resuscitation. 2015;89:36–42. doi:10.1016/j.resuscitation.2014.12.031
106. Cheng D. The EKG of hypothermia1. J Emerg Med. 2002;22(1):87–91. doi:10.1016/S0736-4679(01)00441-3
107. Feldman A, Freedberg NA, Antonelli D, Rozner E, Turgeman Y. Prognostic Value of J (Osborn) Waves on Surface Electrocardiogram Tracing during Therapeutic Hypothermia in Out-of-Hospital Cardiac Arrest Survivors (JOW trial). Isr Med Assoc J. 2021;23(5):291–296.
108. de Souza D, Riera ARP, Bombig MT, et al. Electrocardiographic changes by accidental hypothermia in an urban and a tropical region. journal of Electrocardiology. 2007;40(1):47–52. doi:10.1016/j.jelectrocard.2006.08.094
109. Doshi HH, Giudici MC. The EKG in hypothermia and hyperthermia. journal of Electrocardiology. 2015;48(2):203–209. doi:10.1016/j.jelectrocard.2014.12.001
110. Marques A, Caldeira D, Briosa A, João I, Pereira H. Alterações Eletrocardiográficas Induzidas pela Hipotermia. Arq Bras Cardiol. 2020;114(6):1076–1077. doi:10.36660/abc.20200081
111. Rolfast CL, Lust EJ, de Cock CC. Electrocardiographic changes in therapeutic hypothermia. Crit Care. 2012;16(3):1–7. doi:10.1186/cc11369
112. Menezes MA, Herbella FAM. Pathophysiology of gastroesophageal reflux disease. World J Surg. 2017;41(7):1666–1671. doi:10.1007/s00268-017-3952-4
113. Milovanovic B, Filipovic B, Mutavdzin S, et al. Cardiac autonomic dysfunction in patients with gastroesophageal reflux disease. World J Gastroenterol. 2015;21(22):6982. doi:10.3748/wjg.v21.i22.6982
114. Kaya H, Barutçu S. Gastroesophageal reflux disease is associated with abnormal ventricular repolarization indices. Turk J Gastroenterol. 2020;30(12):1021. doi:10.5152/tjg.2019.181008
115. Ciobanu A, Tse G, Liu T, et al. Electrocardiographic measures of repolarization dispersion and their relationships with echocardiographic indices of ventricular remodeling and premature ventricular beats in hypertension. J. Geriatr Cardiol. 2017;14(12):717.
116. Nichols KB, Littmann L. Electrical alternans as a manifestation of pulmonary embolism. Am J Emerg Med. 2011;9(29):1236. e5–1236. e7.
117. Hubloue I, Schoors D, Wilde C, Diltoer M, Van Tussenbroek F. Early electrocardiographic signs in acute massive pulmonary embolism. Eur J Emerg Med. 1996;3(3):199–204. doi:10.1097/00063110-199609000-00012
118. Marchick MR, Courtney DM, Kabrhel C, et al. 12-lead ECG findings of pulmonary hypertension occur more frequently in emergency department patients with pulmonary embolism than in patients without pulmonary embolism. Ann Emerg Med. 2010;55(4):331–335. doi:10.1016/j.annemergmed.2009.07.025
119. Shopp JD, Stewart LK, Emmett TW, Kline JA. Findings from 12‐lead electrocardiography that predict circulatory shock from pulmonary embolism: systematic review and meta‐analysis. Acad Emerg Med. 2015;22(10):1127–1137.
120. Geibel A, Zehender M, Kasper W, Olschewski M, Klima C, Konstantinides SV. Prognostic value of the ECG on admission in patients with acute major pulmonary embolism. Eur Respir J. 2005;25(5):843–848.
121. Larssen MS, Hodnesdal C, Skjorten I, et al. Mechanisms of ECG changes in chronic obstructive pulmonary disease. Eur Respir Soc. 2016.
122. Gupta P, Jain H, Gill M, et al. Electrocardiographic changes in Emphysema. World J Cardiol. 2021;13(10):533.
123. Kotlyarov S, Kotlyarova A. Bioinformatic Analysis of ABCA1 Gene Expression in Smoking and Chronic Obstructive Pulmonary Disease. Membranes. 2021;11(9):674.
124. Calaras D, Mathioudakis AG, Lazar Z, Corlateanu A. Combined Pulmonary Fibrosis and Emphysema: comparative Evidence on a Complex Condition. Biomedicines. 2023;11(6):1636.
125. Corlateanu A, Montanari G, Mathioudakis A. Management of stable COPD: an update. Curr Respir Med Rev. 2013;9(6):352–359.
126. Corlateanu A, Plahotniuc A, Corlateanu O, et al. Multidimensional indices in the assessment of chronic obstructive pulmonary disease. Respir Med. 2021;185:106519.
127. Incalzi RA, Fuso L, De Rosa M, et al. Electrocardiographic signs of chronic cor pulmonale: a negative prognostic finding in chronic obstructive pulmonary disease. Circulation. 1999;99(12):1600–1605.
128. Lazović B, Jovičić N, Radlović V, et al. Electrocardiographic predictors of five-years mortality in chronic obstructive pulmonary disease patients. Srp Arh Celok Lek. 2021;149(3–4).
129. Arsenescu Georgescu C, Anghel L. The significance of new left bundle branch block complicating acute myocardial infarction. Rev Chim. 2018;69(1):144–147.
130. Siegler D. Reversible electrocardiographic changes in severe acute asthma. Thorax. 1977;32(3):328–332.
131. Abdulmanaf AM, Hijran KSK. A Study of Electrocardiographic Changes in Asthmatic Patients Attending Kirkuk General Hospital. Kirkuk J Med Sci. 2021;6(1):18–25.
132. Corlateanu A, Siafakas N, Botnaru V. Defining COPD: from simplistic approach to multilateral assessment of COPD. Curr Respir Care Rep. 2012;1:177–182.
133. Kotlyarov S. Involvement of the innate immune system in the pathogenesis of chronic obstructive pulmonary disease. Int J Mol Sci. 2022;23(2):985.
134. Levis JT. ECG diagnosis: hyperkalemia. Perm J. 2013;17(1):69.
135. Weiss J, Qu Z, Shivkumar K. Electrophysiology of hypokalemia and hyperkalemia. Circ Arrhythmia Electrophysiol. 2017;10(3).
136. Acker CG, Johnson JP, Palevsky PM, Greenberg A. Hyperkalemia in hospitalized patients: causes, adequacy of treatment, and results of an attempt to improve physician compliance with published therapy guidelines. Arch Intern Med. 1998;158(8):917–924.
137. Rafique Z, Aceves J, Espina I, et al. Can physicians detect hyperkalemia based on the electrocardiogram? Am J Emerg Med. 2020;38(1):105–108.
138. Teymouri N, Mesbah S, Navabian SMH, et al. ECG frequency changes in potassium disorders: a narrative review. Am J Cardiovasc. 2022;12(3):112.
139. Krijthe BP, Heeringa J, Kors JA, et al. Serum potassium levels and the risk of atrial fibrillation: the Rotterdam Study. Int J Cardiol. 2013;168(6):5411–5415.
140. Phillips CT, Wang J, Celi LA, Zhang Z, Feng M. Association of hypokalemia with an increased risk for medically treated arrhythmias. PLoS One. 2019;14(6):e0217432.
141. Diercks DB, Shumaik GM, Harrigan RA, Brady WJ, Chan TC. Electrocardiographic manifestations: electrolyte abnormalities. J Emerg Med. 2004;27(2):153–160.
142. El-Sherif N, Turitto G. Electrolyte disorders and arrhythmogenesis. Cardiol J. 2011;18(3):233–245.
143. Webster A, Brady W, Morris F. Recognising signs of danger: ECG changes resulting from an abnormal serum potassium concentration. Emerg Med J. 2002;19(1):74–77.
144. Slovis C, Jenkins R. Conditions not primarily affecting the heart. BMJ. 2002;324(7349):1320–1323.
145. Carlstedt F, Lind L. Hypocalcemic syndromes. CriCare Clin. 2001;17(1):139–153.
146. Ziegler R. Hypercalcemic Crisis. J Am Soc Nephrol. 2001;12(suppl_1).
147. Chorin E, Rosso R, Viskin S. Electrocardiographic Manifestations of Calcium Abnormalities. Ann Noninvasive Electrocardiol. 2016;21(1):7–9.
148. Negru AG, Pastorcici A, Crisan S, Cismaru G, Popescu FG, Luca CT. The role of hypomagnesemia in cardiac arrhythmias: a clinical perspective. Biomedicines. 2022;10(10):2356.
149. Rosanoff A, West C, Elin RJ, et al. Recommendation on an updated standardization of serum magnesium reference ranges. Eur J Nutr. 2022;61(7):3697–3706.
150. Markovits N, Kurnik D, Halkin H, et al. Database evaluation of the association between serum magnesium levels and the risk of atrial fibrillation in the community. Int J Cardiol. 2016;205:142–146.
151. Yang Y, Chen C, Duan P, et al. The ECG characteristics of patients with isolated hypomagnesemia. Front Physiol. 2021;11:617374.
152. Kim M-Y, Jee SH, Yun JE, Baek SJ, Lee D-C. Hemoglobin concentration and risk of cardiovascular disease in Korean men and women-the Korean heart study. J Korean Med Sci. 2013;28(9):1316–1322.
153. Anderson J, Glynn LG, Newell J, Iglesias AA, Reddan D, Murphy AW. The impact of renal insufficiency and anaemia on survival in patients with cardiovascular disease: a cohort study. BMC Cardiovasc Disord. 2009;9:1–8.
154. Kwon JM, Cho Y, Jeon K-H, et al. A deep learning algorithm to detect anaemia with ECGs: a retrospective, multicentre study. Lancet Digit Health. 2020;2(7):e358–e367.
155. Stanojević M, Stankov S. Electrocardiographic changes in patients with chronic anemia. Srp Arh Celok Lek. 1998;126(11–12).
156. Khatri M, Deokar V, Patel J, Jaju G. Study of electrocardiographic changes in mild, moderate and severe anaemia in a tertiary care hospital. Int J Contemp Med Res. 2018;5(12):9–13.
157. Pereira AA, Sarnak MJ. Anemia as a risk factor for cardiovascular disease: management of comorbidities in kidney disease in the 21st century: anemia and bone disease. Kidney Int. 2003;64:S32–S39.
158. Kumari R, Bharti RK, Singh K, et al. Prevalence of iron deficiency and iron deficiency anaemia in adolescent girls in a tertiary care hospital. J Clin Diagn Res. 2017;11(8):7.
159. Scheller B, Pipa G, Kertscho H, et al. Low hemoglobin levels during normovolemia are associated with electrocardiographic changes in pigs. Shock. 2011;35(4):375–381.
160. Biradar SM, Holiyachi R, Shannawaz M, Teja VR. Electrocardiographic abnormalities in severe anaemia and its reversibility after correction of anaemia in North Karnataka, India. IJAM. 2020;7(10):1566–1569.
161. Khode VH, Kammar K. QTc Changes in Non-pregnant Females with Severe iron Deficiency Anaemia. J Clin Diagn Res. 2012;6(5).
162. Bindra K, Berry C, Rogers J, et al. Abnormal haemoglobin levels in acute coronary syndromes. J Assoc Physicians. 2006;99(12):851–862.
163. Patil A, Munavalli VP, Morappanavar K. Study of Electrocardiographic Findings in Severe Anaemia. Jebmh. 2020;7(49):2964–2967.
164. Sumalatha B, Jyotsna M, Indrani G. Electrocardiographic Changes during Normal Pregnancy. Indian J Cardiovasc Dis Women. 2017;02:035–038.
165. Traian MG, Coman AE, Popa E, Traian L, Petrovanu R. Stress: from symptom to disease. Rev Med Chir Soc Med Nat Iasi. 2013;117(1):72–77.
166. Boyle DM, Lloyd‐Jones R. The electrocardiographs st segment in pregnancy. BJOG. 1966;73(6):986–987.
167. Sunitha M, Chandrasekharappa S, Electrocardiographic QRS Axis BS. Q wave and T-wave changes in 2nd and 3rd trimester of normal pregnancy. J Clin Diagn Res. 2014;8(9).
168. Oram S, Holt M. Innocent depression of the s‐t segment and flattening of the t‐wave during pregnancy. BJOG. 1961;68(5):765–770.
169. Drenthen W, Boersma E, Balci A, et al. Predictors of pregnancy complications in women with congenital heart disease. Eur Heart J. 2010;31(17):2124–2132.
170. Wang Y, Joyner RW, Wagner MB, Cheng J, Lai D, Crawford BH. Stretch-activated channel activation promotes early afterdepolarizations in rat ventricular myocytes under oxidative stress. Am J Physiol Heart Circ Physiol. 2009;296(5).
171. Ramlakhan KP, Kauling RM, Schenkelaars N, et al. Supraventricular arrhythmia in pregnancy. Heart. 2022;108(21):1674–1681.
172. Gowda RM, Punukollu G, Khan IA, et al. Lone atrial fibrillation during pregnancy. Int J Cardiol. 2003;88(1):123–124.
173. Kuczkowski KM. New onset transient lone atrial fibrillation in a healthy parturient: déjà vu. Int J Cardiol. 2004;97(2):339.
174. Wichter T, Milberg P, Wichter HD, Dechering DG. Pregnancy in arrhythmogenic cardiomyopathy. Herzschrittmacherther Elektrophysiol. 2021;32(2):186–198.
175. Ng KS, Lauer MR, Young C, Liem LB, Sung RJ. Correlation of P-wave polarity with underlying electrophysiologic mechanisms of long RP’ tachycardia. Am J Cardiol. 1996;77(12):1129–1132.
176. Riva SI, Della Bella P, Fassini G, Carbucicchio C, Tondo C. Value of analysis of ST segment changes during tachycardia in determining type of narrow QRS complex tachycardia. J Am Coll Cardiol. 1996;27(6):1480–1485.
177. Seth R, Moss AJ, McNitt S, et al. Long QT Syndrome and Pregnancy. JACC. 2007;49(10):1092–1098.
178. Kusumoto FM, Schoenfeld MH, Barrett C, et al. 2018 ACC/AHA/HRS guideline on the evaluation and management of patients with bradycardia and cardiac conduction delay: a report of the American College of Cardiology/American Heart Association Task Force on Clinical Practice Guidelines and the Heart Rhythm Society. J Am Coll Cardiol. 2019;74(7):e51–e156.
179. Matta B, Magee P. Wenckebach type heart block following spinal anaesthesia for caesarean section. Can J Anaesth. 1992;39:1067–1068.
180. Thaman R, Curtis S, Faganello G, et al. Cardiac outcome of pregnancy in women with a pacemaker and women with untreated atrioventricular conduction block. Europace. 2011;13(6):859–863.
181. Young D, Turaga NSS, Amisha F, Hayes K, Paydak H, Devabhaktuni SR. Recurrence of complete heart block in pregnancy. HeartRhythm Case Rep. 2021;7(10):679–682.
182. Mahmoudi E, Mollazadeh R, Mansouri P, et al. Ventricular repolarization heterogeneity in patients with COVID‐19: original data, systematic review, and meta‐analysis. Clin Cardiol. 2022;45(1):110–118.
183. Ulinici M, Covantev S, Wingfield-Digby J, Beloukas A, Mathioudakis AG, Corlateanu A. Screening, diagnostic and prognostic tests for COVID-19: a comprehensive review. Life. 2021;11(6):561.
184. Timpau A-S, Miftode R-S, Leca D, et al. A real Pandora’s box in pandemic times: a narrative review on the acute cardiac injury due to COVID-19. Life. 2022;12(7):1085.
185. Yenerçağ M, Arslan U, Doğduş M, et al. Evaluation of electrocardiographic ventricular repolarization variables in patients with newly diagnosed COVID-19. J Electrocardiol. 2020;62:5–9.
186. Lampert J, Miller M, Halperin JL, et al. Prognostic value of electrocardiographic QRS diminution in patients hospitalized with COVID-19 or influenza. Am J Cardiol. 2021;159:129–137.
187. Asoglu R, Tibilli H, Asoglu E, Aladag N, Ozdemir M, Suner A. Evaluation of index of cardiac electrophysiological balance in COVID-19 patients. Bratisl Lek Listy. 2021;122(8):598–604.
188. Anghel L, Tudurachi B-S, Leonte A, et al. The Challenge of High Coronary Thrombotic Events in Patients with ST-Segment Elevation Myocardial Infarction and COVID-19. J Clin Med. 2022;11(21):6542.
189. Nordin C, Kohli A, Beca S, et al. Importance of hepatitis C coinfection in the development of QT prolongation in HIV-infected patients. J Electrocardiol. 2006;39(2):199–205.
190. Abrams MP, Wan EY, Waase MP, et al. Clinical and Cardiac Characteristics of COVID‐19 Mortalities in a Diverse New York City Cohort. J Cardiovasc Electrophysiol. 2020;31(12):3086–3096.
191. Nathala P, Salunkhe V, Samanapally H, et al. Electrocardiographic Features and Outcome: correlations in 124 Hospitalized Patients With COVID-19 and Cardiovascular Events. J Cardiothorac Vasc Anesth. 2022;36(8):2927–2934.
192. Rubin GA, Desai AD, Chai Z, et al. Cardiac corrected QT interval changes among patients treated for COVID-19 infection during the early phase of the pandemic. JAMA Network Open. 2021;4(4):e216842–e216842.
193. Centurion OA. Wide QRS complex and left ventricular lateral repolarization abnormality: the importance of ECG markers on outcome prediction in patients with COVID-19. Am J Med Sci. 2021;362(1):1–2.
194. Angeli F, Spanevello A, De Ponti R, et al. Electrocardiographic features of patients with COVID-19 pneumonia. Eur J Intern Med. 2020;78:101–106.
195. Barman HA, Atici A, Alici G, et al. The effect of the severity COVID-19 infection on electrocardiography. Am J Emerg Med. 2021;46:317–322.
196. Verdecchia P, Cavallini C, Spanevello A, Angeli F. The pivotal link between ACE2 deficiency and SARS-CoV-2 infection. Eur J Intern Med. 2020;76:14–20.
197. Thanassoulis G, Massaro JM, O’Donnell CJ, et al. Pericardial fat is associated with prevalent atrial fibrillation: the Framingham Heart Study. Circ Arrhythm Electrophysiol. 2010;3(4):345–350.
198. Anghel L, Prisacariu C, Arsenescu Georgescu C. Is there a sex difference of cardiovascular risk factors in patients with acute myocardial infarction? Rev Chim. 2018;69(1):255–258.
199. Grigorescu ED, Lăcătușu CM, Floria M, et al. Association of Inflammatory and Metabolic Biomarkers with Mitral Annular Calcification in Type 2 Diabetes Patients. J Pers Med. 2022;12(9):1484.
200. Garcia‐Zamora S, Lee S, Haseeb S, et al. Arrhythmias and electrocardiographic findings in Coronavirus disease 2019: a systematic review and meta‐analysis. Pacing Clin Electrophysiol. 2021;44(6):1062–1074.
Entertainment news
Coup Threats, Mnangagwa Cancels Two Events – ZimEye – ZimEye – Zimbabwe News

Coup Threats, Mnangagwa Cancels Two Events
3 May 2024
Spread the love
By Political Correspondent- President Emmerson Mnangagwa Thursday cancelled two events amid an unspecified “emergency”.
Mnangagwa’s house is shaking following indications that he wants to extend his tenure of office beyond 2028, closing doors for his deputy Constantino Chiwenga, who is warming up for the highest office.
Sources within Zanu PF say Chiwenga is not happy with Mnangagwa’s move and is plotting another Mugabe coup against Mnangagwa.
A local daily reported Friday that Mnangagwa cancelled the swearing-in of the newly-appointed deputy ministers Musa Ncube (National Housing and Social Amenities) and Headman Moyo (Veterans of the Liberation Struggle Affairs) at State House.
Mnangagwa also did not turn up for the groundbreaking ceremony of WestProp’s Hills Golf Estate in Mabelreign, Harare, which he was supposed to officiate.
Speaking at the groundbreaking ceremony, National Housing and Social Amenities Minister Zhemu Soda said the event had been postponed at the State level and could continue as a private event because the President had to attend to some emergency.
Said Soda:
We postponed because of some emergency he (Mnangagwa) had to attend out of town and we are not sure (if) he will be able to join us. As such, the event at State level has been postponed, but the private event can continue.
Related
Entertainment news
Mnangagwa Totally Captures ZCTU – ZimEye – ZimEye – Zimbabwe News

Mnangagwa Totally Captures ZCTU
3 May 2024
Spread the love
By A Correspondent
Stephen Sarkozy Chuma, former MDC Alliance and CCC Youth Assembly spokesperson, has levelled serious allegations against the Zimbabwe Congress of Trade Unions (ZCTU), claiming that it has fallen under the sway of Zanu PF leader Emmerson Mnangagwa.
In a statement issued on Thursday, Chuma did not mince words, stating:
“Workers Day! A reminder of how ZANU PF destroyed industries & state enterprises like NRZ. Big companies fled due to bad policies. Industries now turned into churches.
A country of loafers & vendors! A few lucky to be employed are getting peanuts. Workers Arise!”
Taking to X, Chuma further accused the ZCTU of being a mere mouthpiece for Mnangagwa’s administration:
“Post @MutasaPeter, ZCTU has become a hollow pipe that puffs & ululates to Emmerson Mnangagwa’s dross.
A Workers Day organized under the current ZCTU is an insult to genuine workers. An insult to Benjamin Burombo, Joshua Nkomo & Morgan Tsvangirai!”
Chuma’s remarks highlight growing concerns over the perceived alignment of the ZCTU with the ruling party, sparking debate within the political landscape of Zimbabwe.
Related
Entertainment news
Cave of Crystals: The deadly cavern in Mexico dubbed ‘the Sistine Chapel of crystals’ – Livescience.com

The Cave of Crystals is an underground cavern filled with tree-size gypsum crystals, including some of the largest natural crystals ever found. The cave is located around 980 feet (300 meters) deep and is connected to a lead, zinc and silver mine in Naica, 65 miles (105 kilometers) southeast of Chihuahua City. The mine was flooded almost 10 years ago after workers accidentally broke into an aquifer, but the Cave of Crystals sits higher in the ground, meaning the water didn’t reach it.
Miners discovered the Cave of Crystals by chance in 2000 while drilling a side tunnel to help ventilation in the mine. When they stepped inside, they discovered a chamber packed with enormous, milky-white crystals — the largest measuring over 37 feet (11 meters) long and 3.3 feet (1 m) wide. The crystals are made of selenite gypsum, a sulfate mineral that forms from salts dissolved in groundwater. It is so soft you can scratch it with a fingernail.
Related: Water leaking into Earth’s core may have birthed a mysterious layer that churns out crystals
Mining operations in Naica began in 1974, and several crystal-filled caves have since been discovered — including the Cave of Swords, which is studded from floor to ceiling with dagger-like crystals. But the Cave of Crystals is by far the biggest, stretching 360 feet (110 m) across with a maximum volume of 210,000 cubic feet (6,000 cubic meters) — more than twice the size of an Olympic swimming pool. The cave is shaped like a horseshoe and carved out of limestone rock.
“It’s the Sistine Chapel of crystals,” Juan Manuel García-Ruiz, a geologist with the Spanish National Research Council (CSIC) and at the University of Granada in Spain, who has studied the cave, told National Geographic in 2007.
The cave sits on a fault line and above a magma reservoir buried 2 to 3 miles (3 to 5 km) beneath Naica. Roughly 26 million years ago, magma rose from this chamber, forcing mineral-rich waters upward through cracks in the rock. The scalding water opened caverns in the limestone and formed deposits that crystallized over thousands of years as it slowly cooled. Temperatures later stabilized at around 136 degrees Fahrenheit (58 degrees Celsius), creating ideal conditions for gypsum crystals to grow to mammoth proportions from a mineral called anhydrite.
The conditions in the cave are just right for crystals, but they are deadly to humans. Temperatures stayed the same after the water drained but humidity reached over 90%. At that humidity level, sweating has no cooling effect on the body. As a result, people need proper protection to stay in the cave for longer than 10 minutes. Walking among the crystals is also dangerous, because the beams are slick and with condensation and extremely slippery.
The crystals are growing more slowly now they aren’t submerged, and their appearance will likely change over time as they become progressively more dehydrated. But for now, the cave “is OK,” García-Ruiz told Live Science in an email.


Russian soldiers moves in to occupy Niger airbase vacated by US military

Coup Threats, Mnangagwa Cancels Two Events – ZimEye – ZimEye – Zimbabwe News

Mnangagwa Totally Captures ZCTU – ZimEye – ZimEye – Zimbabwe News
About Us

EmPawa Business Funding – Simplifying Business Financing | With Susan Sundai

Breaking news – Chronicle
-
About Us5 months ago
About Us
-
 Business5 months ago
EmPawa Business Funding – Simplifying Business Financing | With Susan Sundai
-
 music3 weeks ago
Breaking news – Chronicle
-

 money markets2 weeks ago
Breaking news – Chronicle
-

 gospel2 weeks ago
American gospel artistes to grace Zim – NewsDay
-
gospel2 weeks ago
American gospel artistes to grace Zim – NewsDay
-
gospel2 weeks ago
American gospel artistes to grace Zim – NewsDay
-

 music3 weeks ago
Music, the ‘Liberation Doctrine’ in Zimbabwe’s war – Chronicle